Week 8 (Nov 25): Representation #4 - additional data relationships
Hierarchical Edge Bundles: Visualization of Adjacency Relations in Hierarchical Data.
Danny Holten, InfoVis06
Concept
Hierarchical edge bundles are a way of dealing with visualizations that contain both inclusion relations (parent-child relationships) and adjacency relations (non-hierarchical relations), by choosing the layout of adjacency relations based on the underlying inclusion relations’ layout.
Context
Usually the existence of both adjacency and inclusion relations is dealt with by drawing some sort of tree visualization and then drawing additional links between the nodes. This can get very messy: the links may occlude the tree nodes, and because the spatial arrangement priority goes to the tree, it is difficult to give the links a meaningful structure.
Implementation
Hierarchical edge bundles gives adjacency links a structure. It does this by using the layout of the underlying hierarchy as a guide for drawing the adjacency links: it finds the least common ancestor (LCA) of a link’s endpoints, creates a polygon by making a pathway between the endpoints that goes through the LCA, and then uses this as the polygon for drawing a spline curve representation of the link.
In the implementation, the LCA node is actually removed so that there is no curvature towards the parent. This can cause some ambiguity, so there is a “bundling strength” parameter that alters the curve shapes a little bit - changing this parameter can be used to resolve ambiguities that arise. Additionally, alpha blending is used so that shorter curves appear darker (otherwise they tend to be less visible on screen).
The algorithm has been designed to work with any existing tree layout. Relations between low levels in the tree depicted as hierarchical edge bundles will also implicitly show relations between higher levels of the tree.
-jagoda
Network Visualization by Semantic Substrates
Shneiderman, B. and Aris, A.,
This paper offers a strategy for improving existing network visualization: 1) the layouts of the network is based on user-defined substrates, which means non-overlapping regions where node placement is based on node attributes and 2) users can interact to change the visibility of links thus preventing clutters and ensuring comprehensibility.
Identifying tasks when viewing network visualization
To frame the goal of their visualization, the authors firstly identify 14 tasks that are relevant to at least 6 *challenges*. The 6 challenges are:
- C1 Basic networks
- C2 Node labels
- C3 Link labels
- C4 Directed networks
- C5 Node attributes
- C6 Link attributes
Based on these challenges, the authors propose
- 8 tasks for C1
- 2 more tasks for C[2, 3]
- 4 more tasks for C[5, 6]
Interaction requirements
Dynamic queries technique is considered in their work (in my opinion of less originality)
Semantic substrates for node layout
Given a representation of network, we can firstly semantically define (2 – 3) non-overlapping regions. For example, given a citation relationship network between papers, we can firstly place these papers into four categories: journal, conference, book and web. Following that, if there are N substrates, there will be N kinds of nodes and C(2,N) + N kinds of links for non-directed ones and A(2,N) + 2N for directed ones. And all these varieties are semantically-salient.
The authors point out two advantages of doing such substrates:
Proportionally-sized regions would immediately give users some idea of the relative cardinality of each category; Users can quickly distinguish links that cross from one category (region) to another. Also there might be some critiques toward using this method. Firstly it assumes the network inherently contains categorical attributes which might not be the case. Secondly by separating nodes and links, the linking might be made more complicated. And one other critique the authors fail to mention is scalability. What happens if there are 5, 10, 20 or 100 categories?
The legal precedent example
In this example, there are three clear categories: supreme court (S) , circuit court (C) and district court (D). And citations between courts are distinctly categorized into external ones namely S2S, C2S, D2S, D2C as well as internal ones namely S2S, C2C and D2D. Users can dynamically query with certain criteria so that the visualization only shows part of the network hence much less likelihood of visual clutter.
However, there are still links cluttering which should be addressed in ways other than dynamic queries.
Christopher Collins and Sheelagh Carpendale. VisLink: Revealing Relationships Amongst Visualizations. IEEE Transactions on Visualization and Computer Graphics (Proc. of the IEEE Conf. on Information Visualization), 13(6), November--December, 2007.
VisLink: a method by which visualizations and the relationships be- tween them can be interactively explored.
Vislink is an environment where one can display multiple 2d visualizations, re-position and reorganize them in 3d, and display relationships between them by propagating edges from one visualization to another.
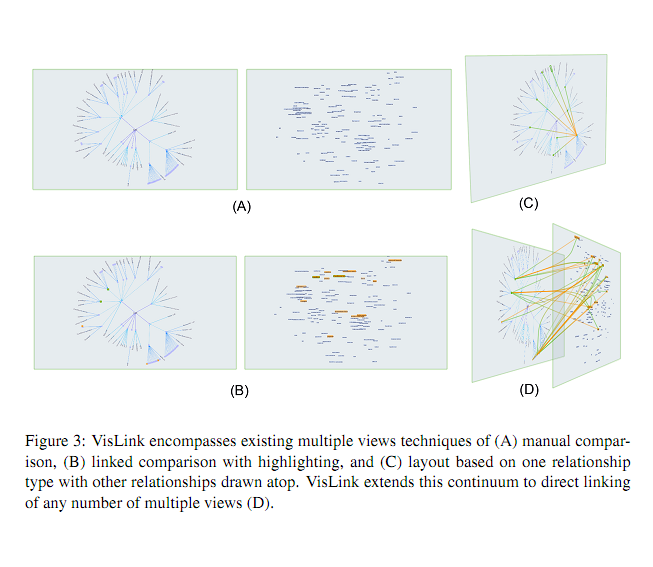
^^^ showing the multiple views in vislink
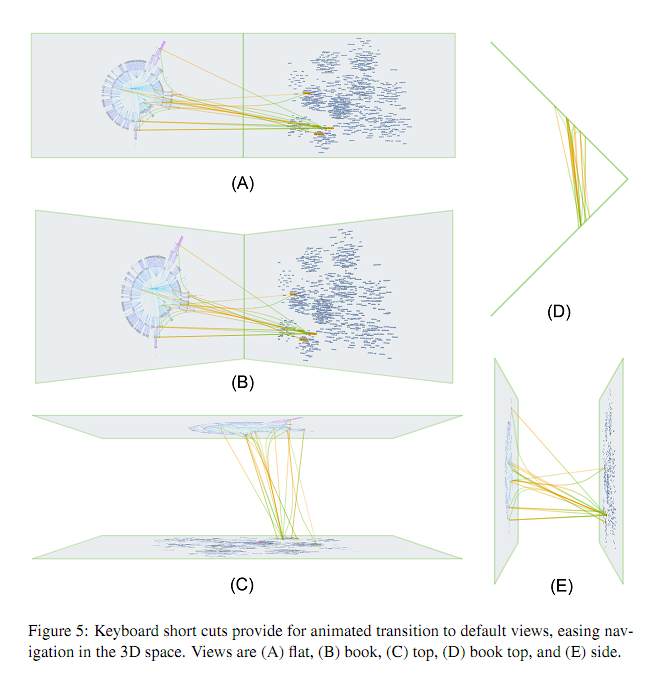
^^^ possible views in vislink
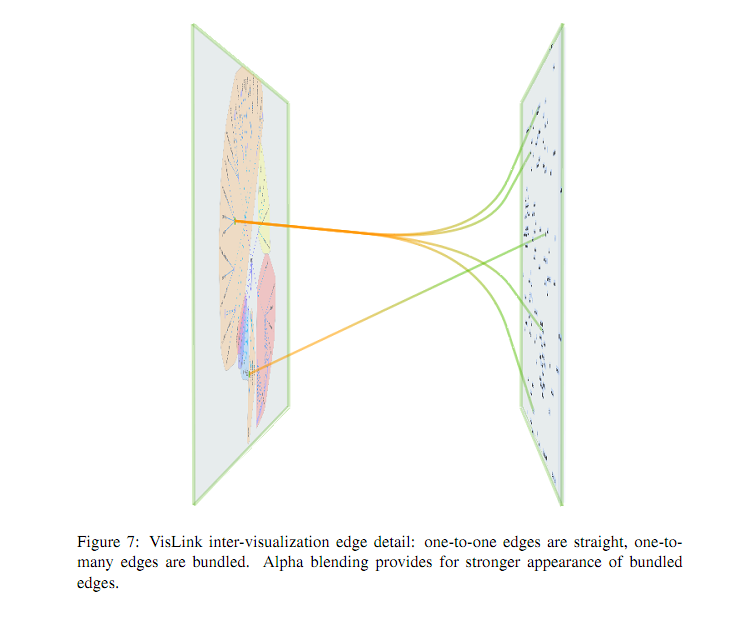
^^^ example of edge bundling possible in vislink
-jonathan