Alternative Layouts for Graphs
Katayoon Etemad
Sheelagh Carpendale
Spirograph inspired visualization of ecological networks
Overview
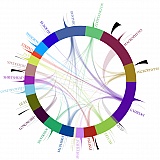
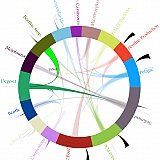
Ecological networks are directed weighted graphs for representing direct and indirect relationships between species in ecosystems. These complex cyclic networks play an important role in understanding an ecosystem’s dynamics. In this paper, we present a visualization layout inspired by Spirograph patterns, specifically designed for ecological networks. Our visualization supports both the direct and indirect quantities commonly required in ecological studies. The layout is circular to reflect the containment of the represented ecosystem and to clarify which connections are internal and which are external. In this layout, nodes are arranged along the circumference of a large circle as arcs, and edges are mapped to thorn-like shapes that represent the direction and the weight of the edge. Finally, we illustrate the use of this visualization on several example ecological networks.
Publication
| Katayoon Etemad, Sheelagh Carpendale and Faramarz Samavati. Node-Ring Graph Visualization Clears Edge Congestion. In I the Proceedings of the IEEE VIS Arts Program (VISAP), 2014. | | |
| Katayoon Etemad, Sheelagh Carpendale and Faramarz Samavati. Spirograph Inspired Visualization of Ecological Network. In Proceedings of Computational Aesthetics in Graphics, Visualization, and Imaging, (CAe'14), pages 81-89, 2014. | | |


