Area of Interest Timelines
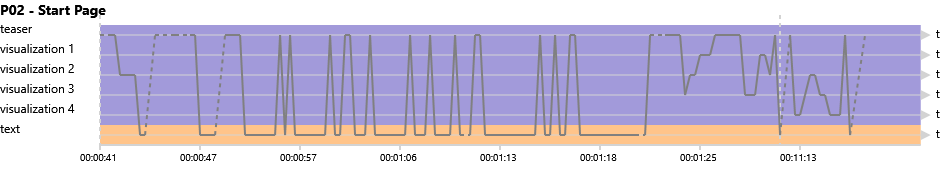
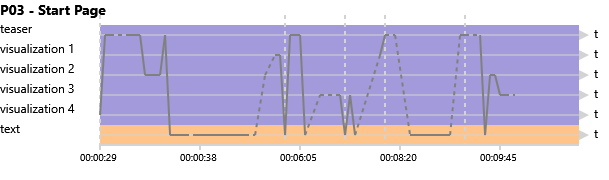
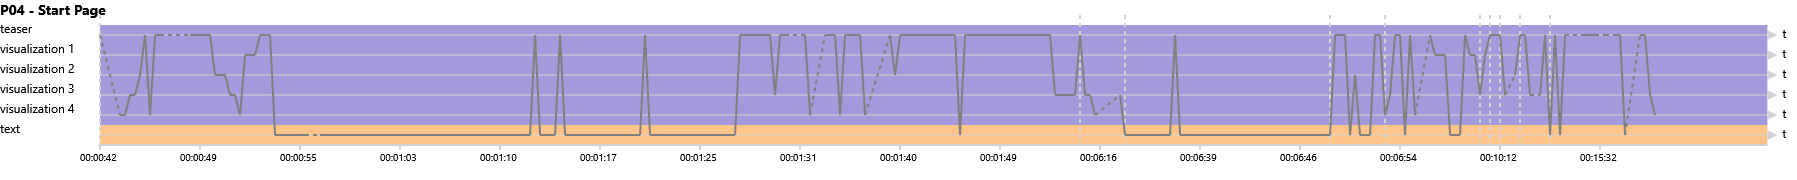
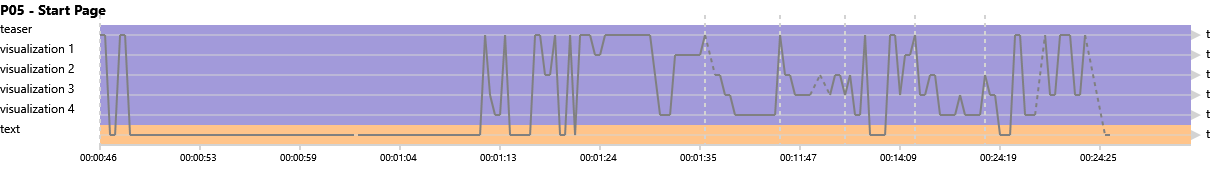
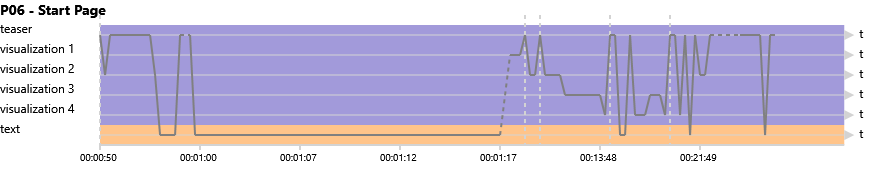
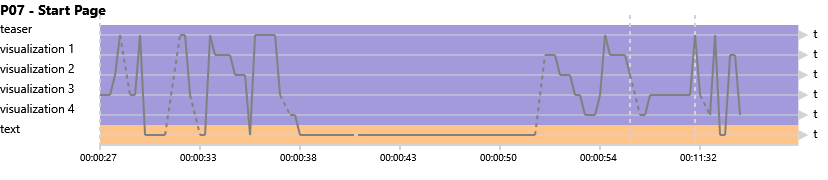
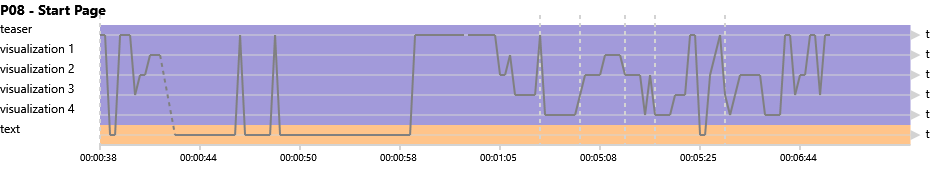
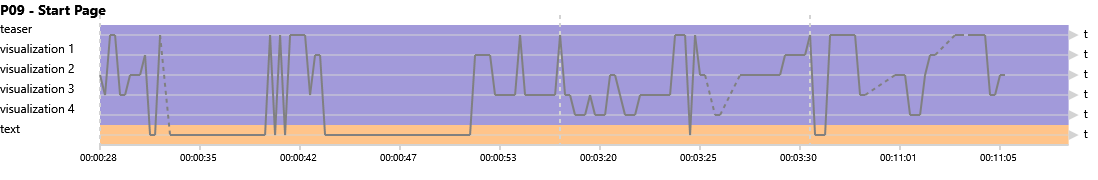
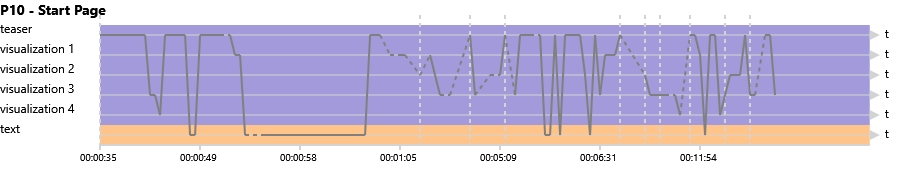
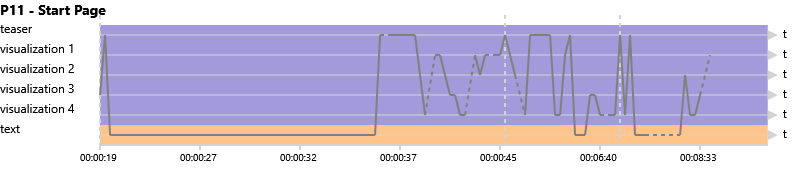
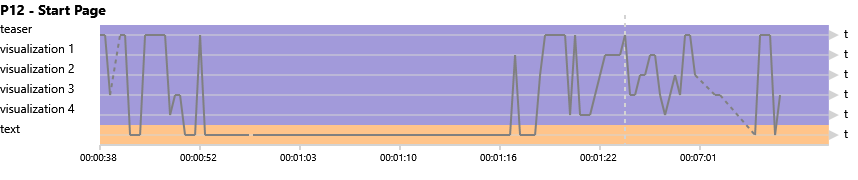
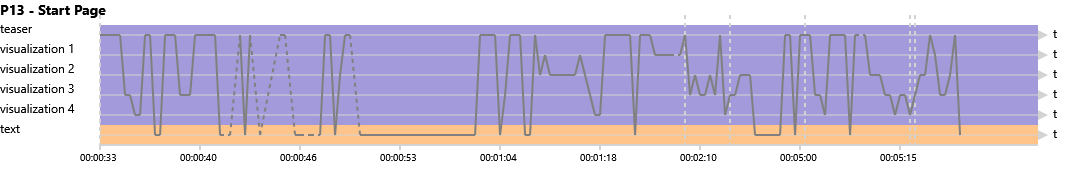
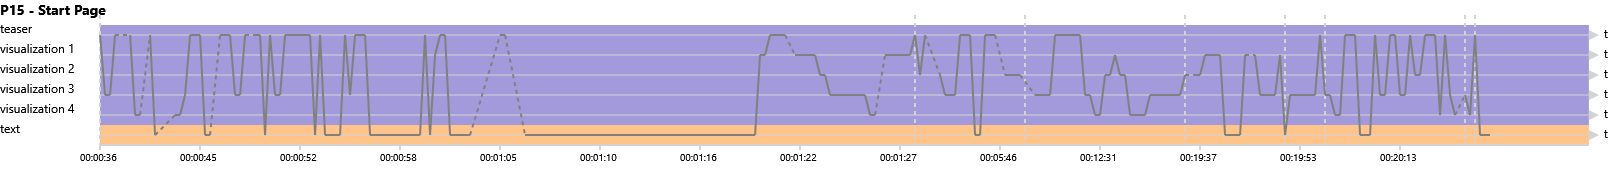
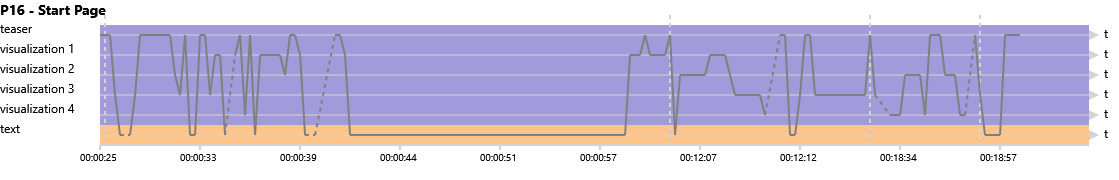
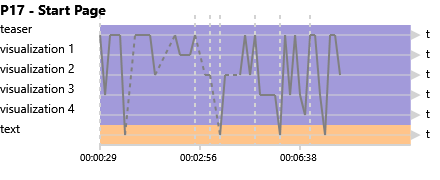
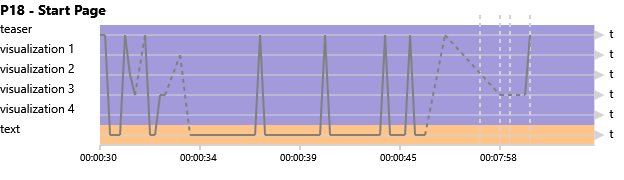
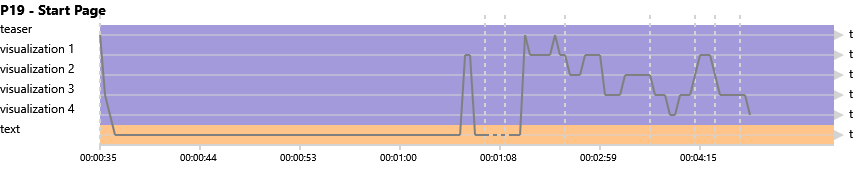
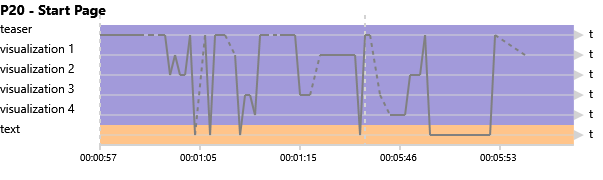
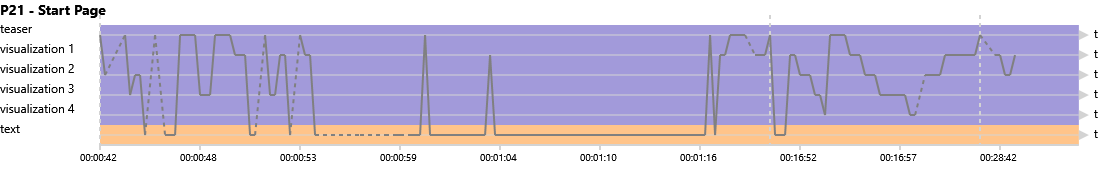
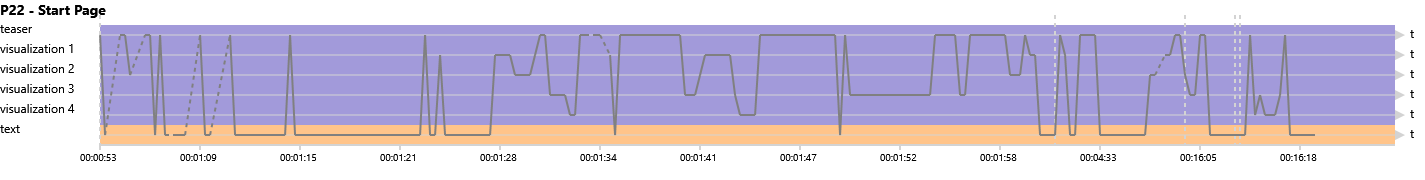
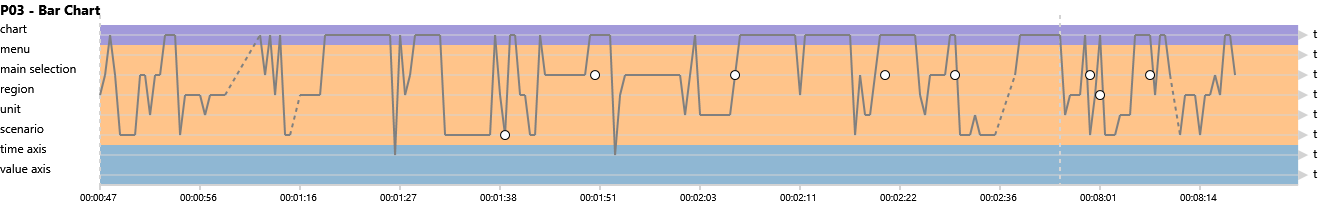
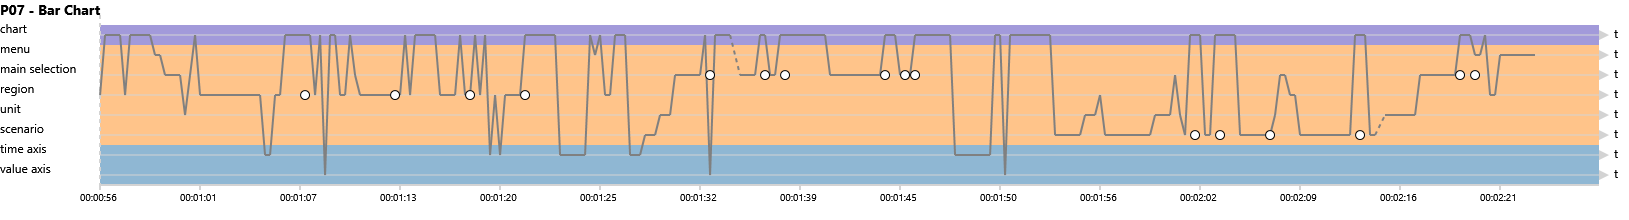
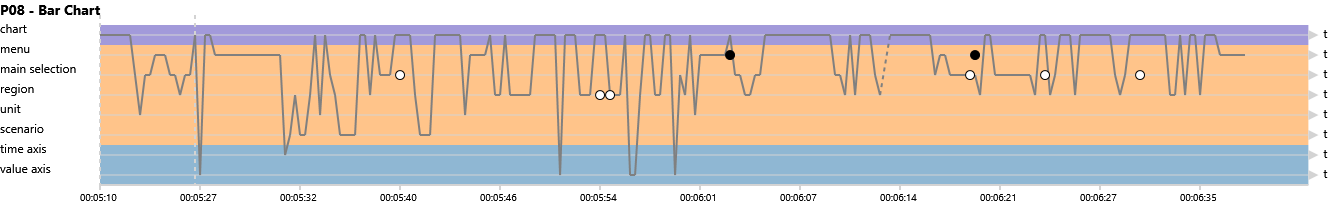
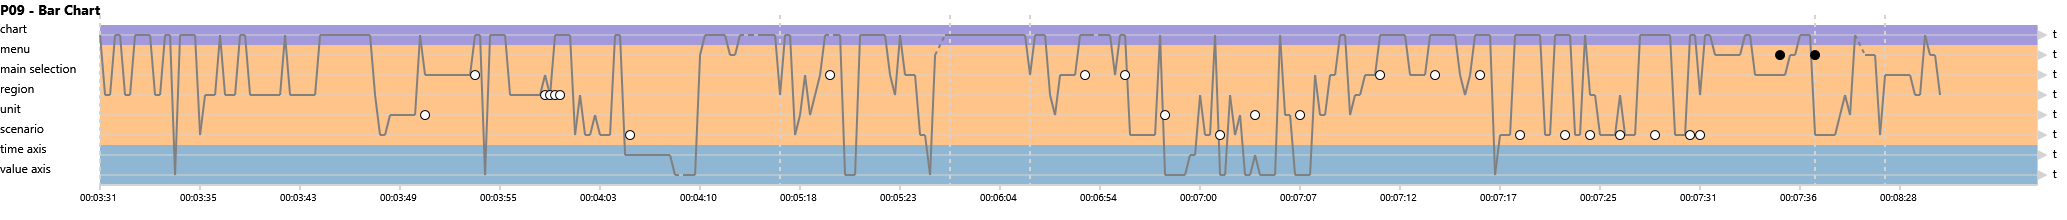
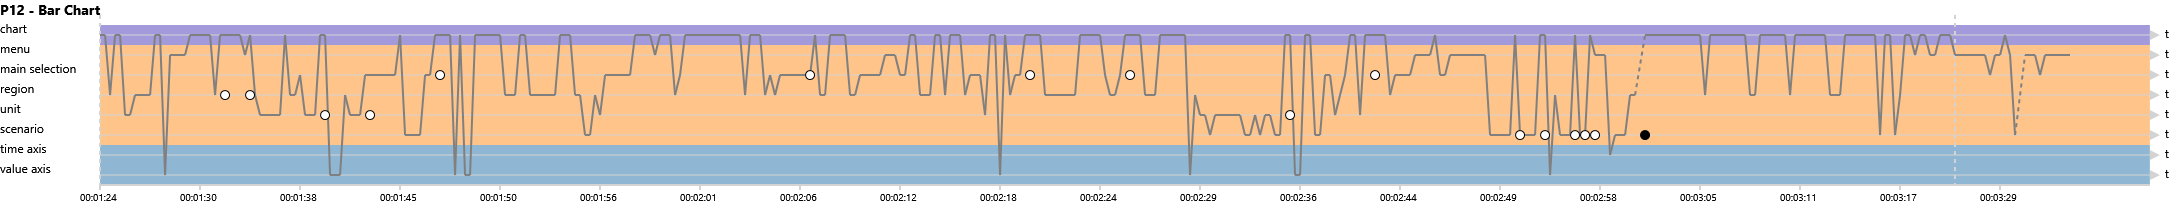
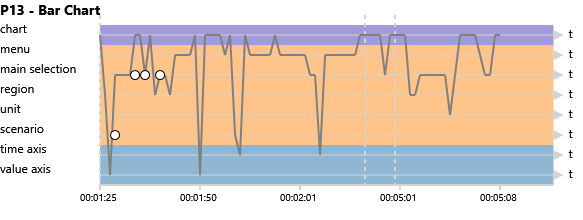
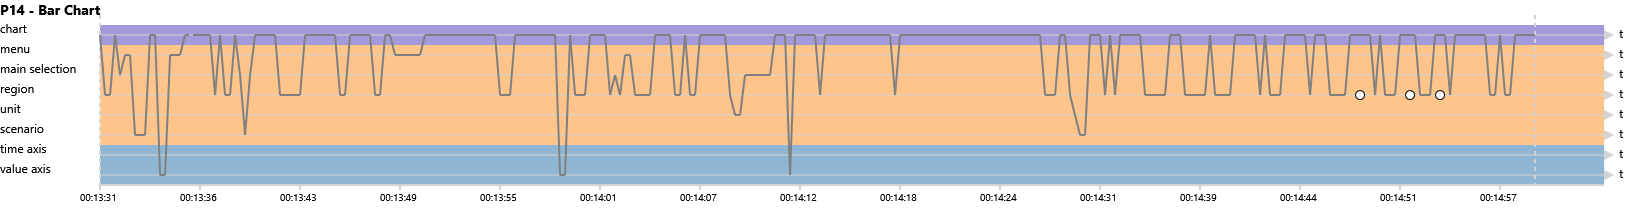
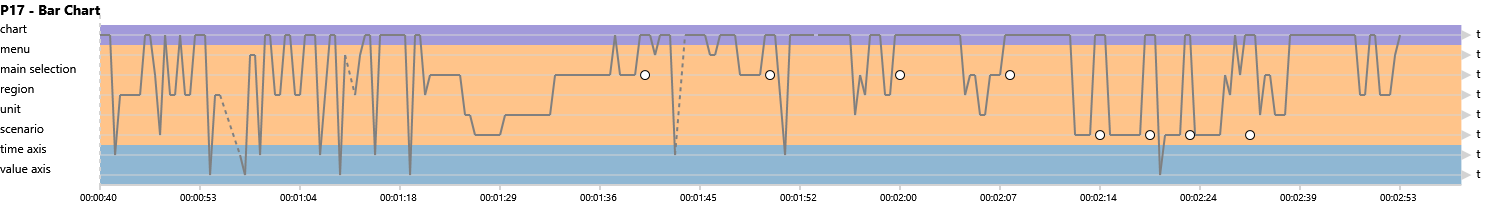
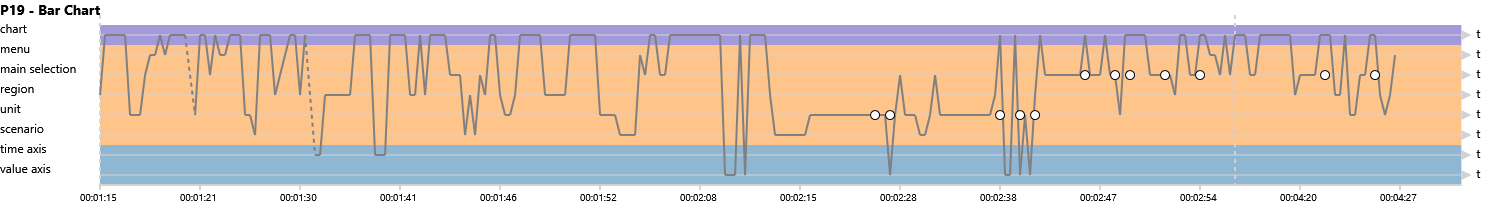
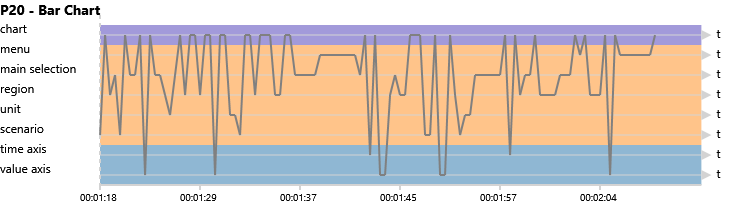
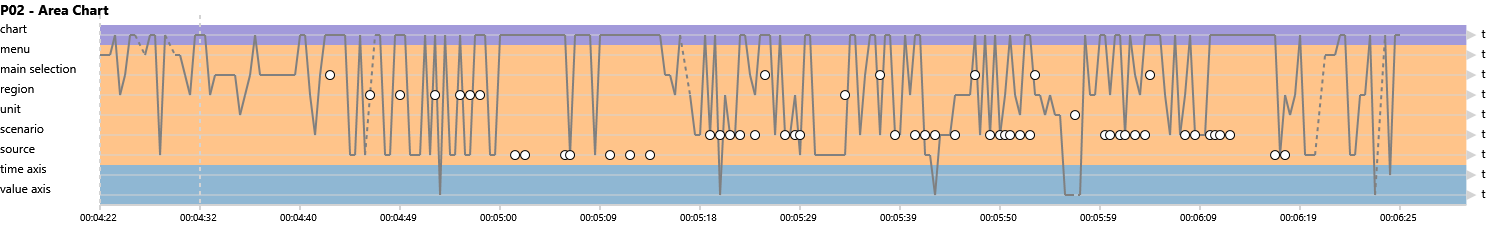
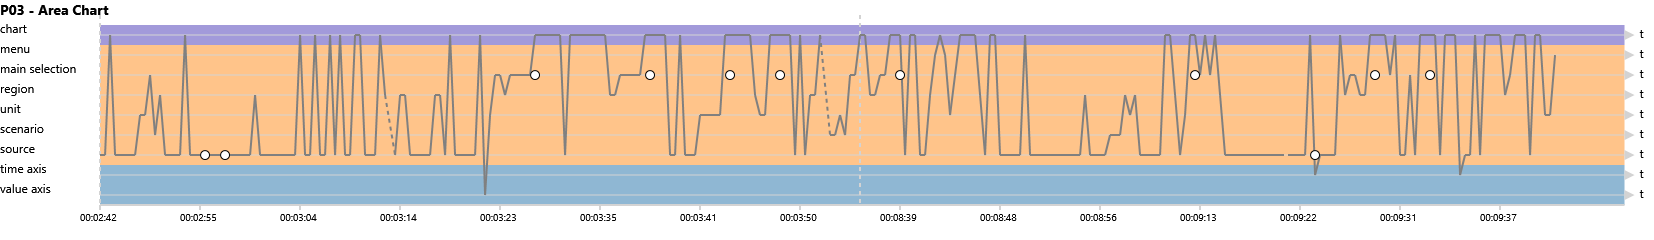
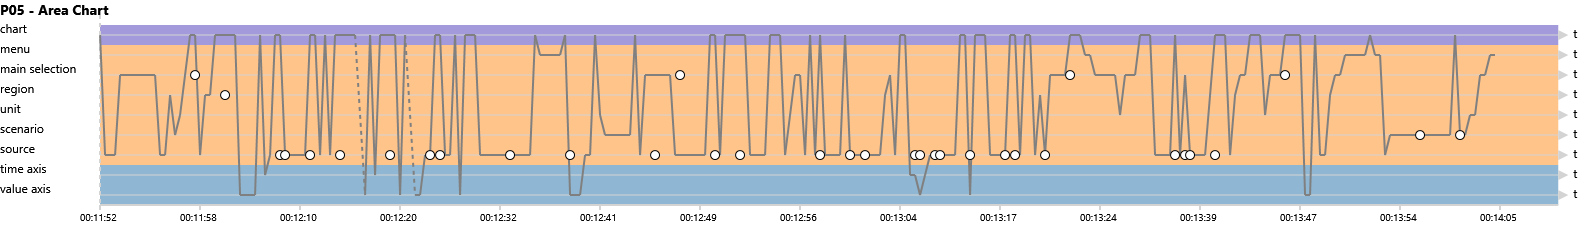
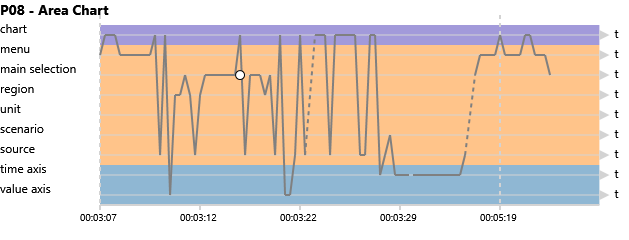
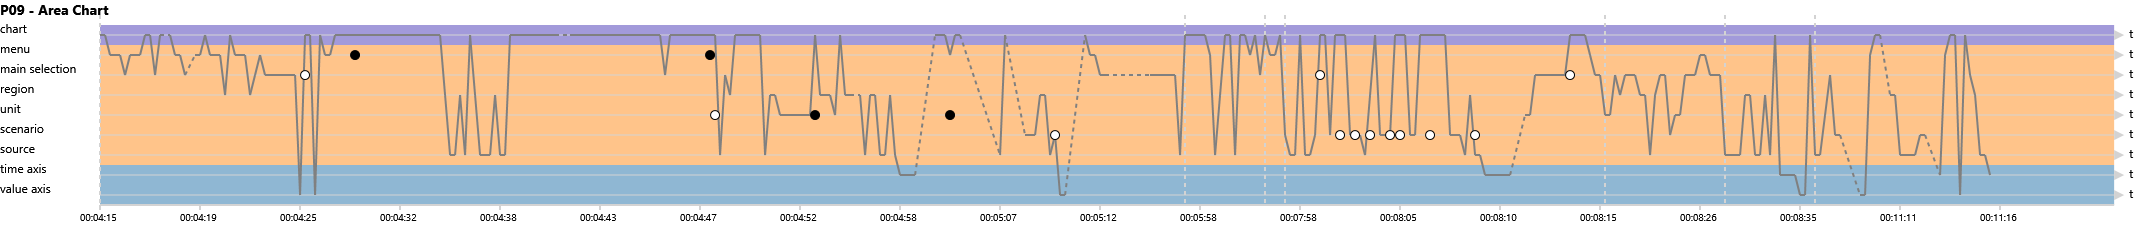
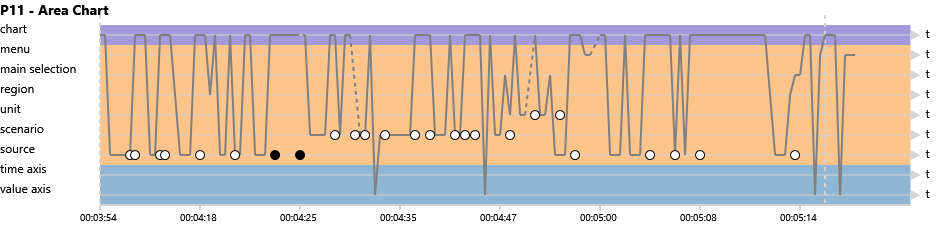
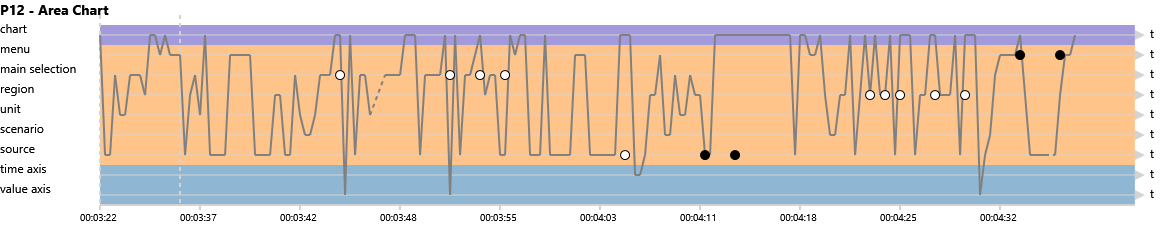
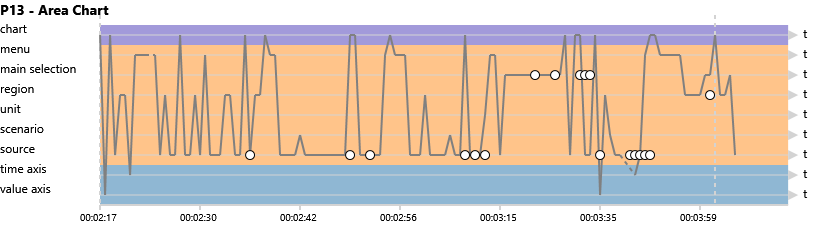
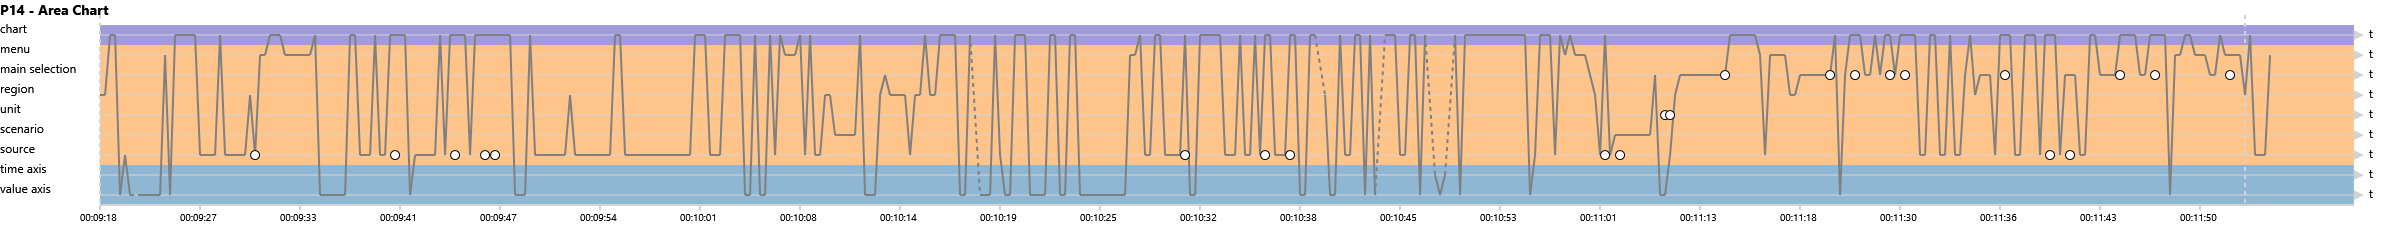
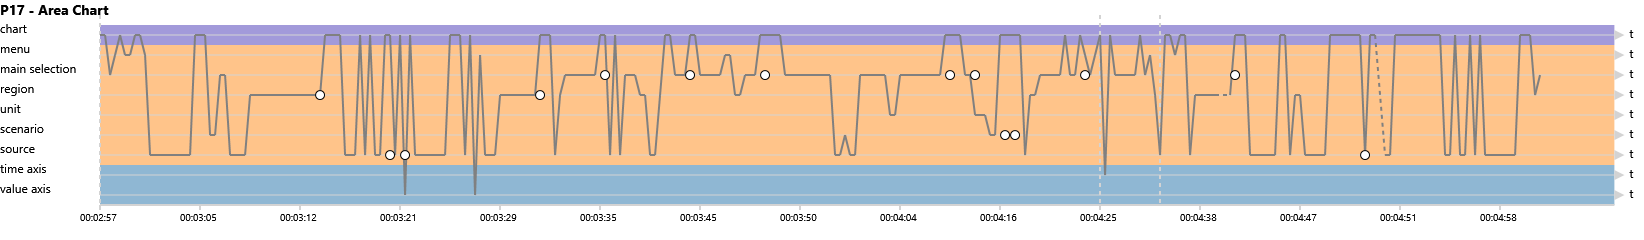
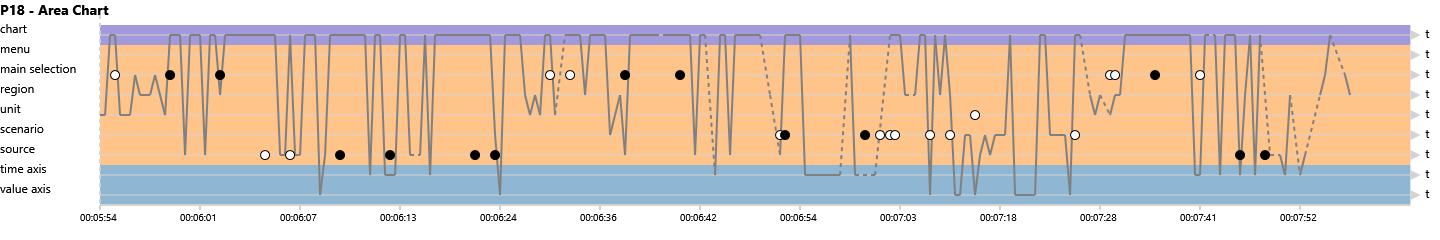
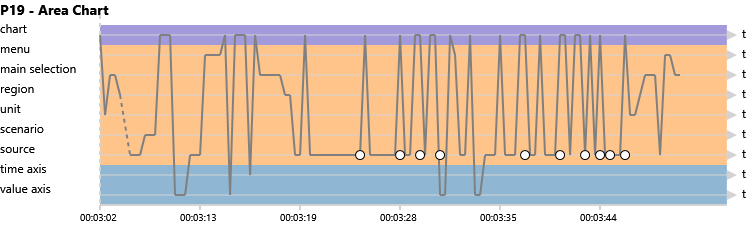
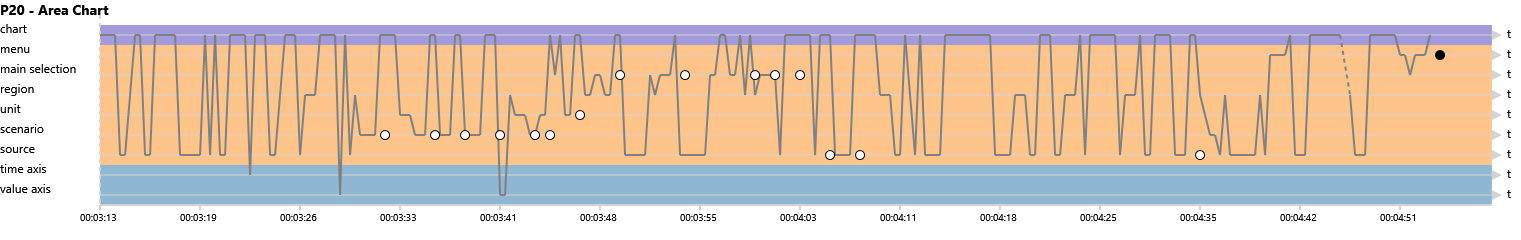
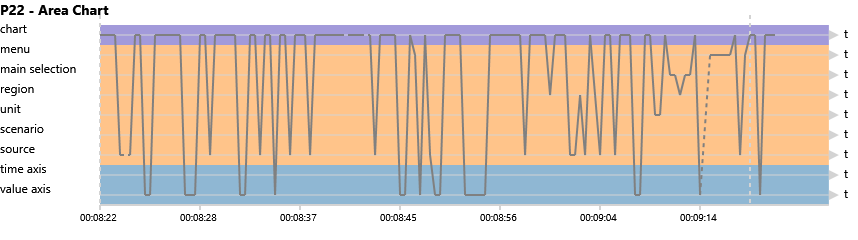
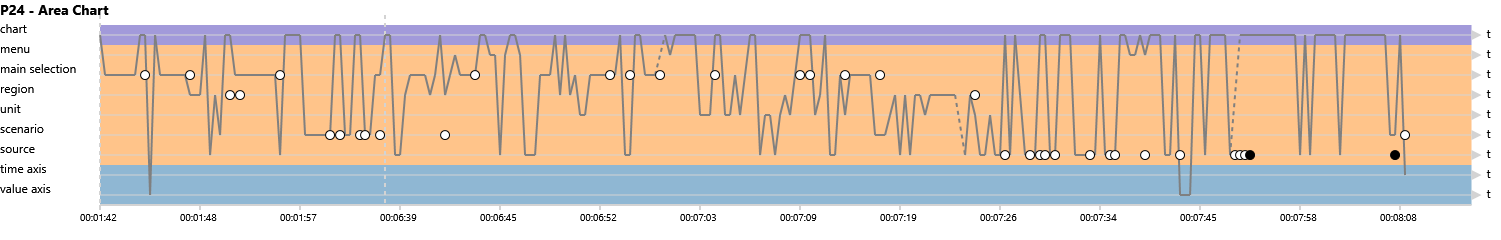
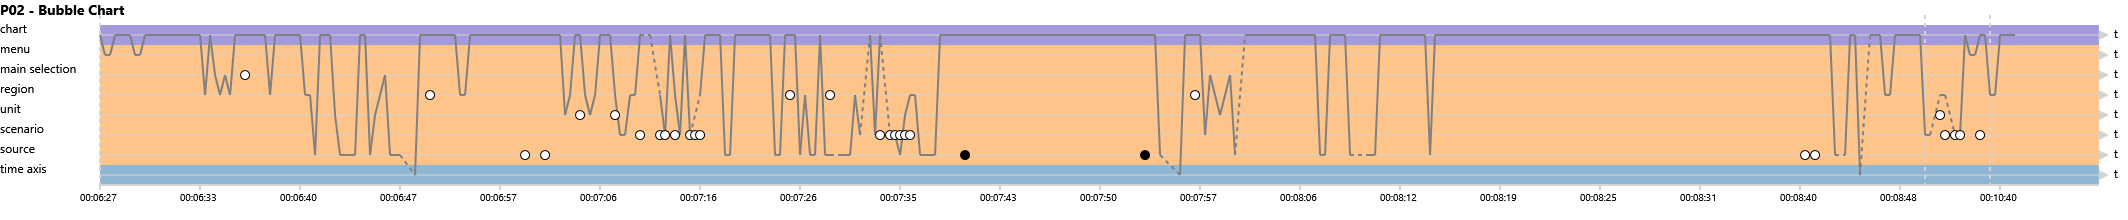
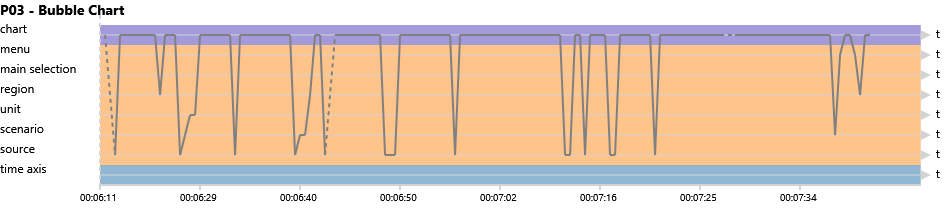
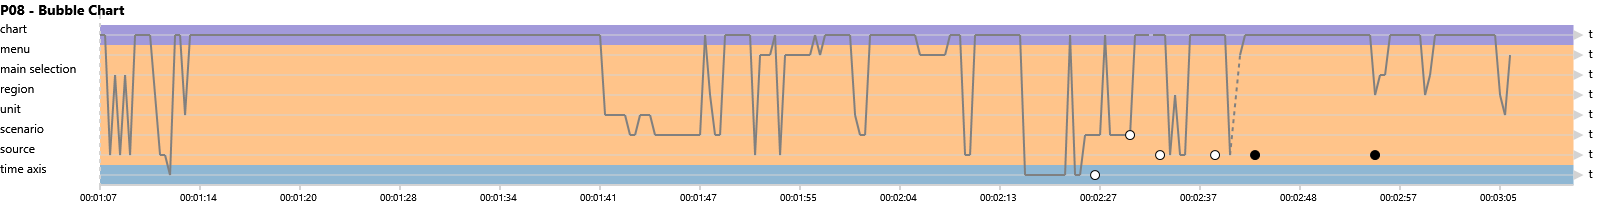
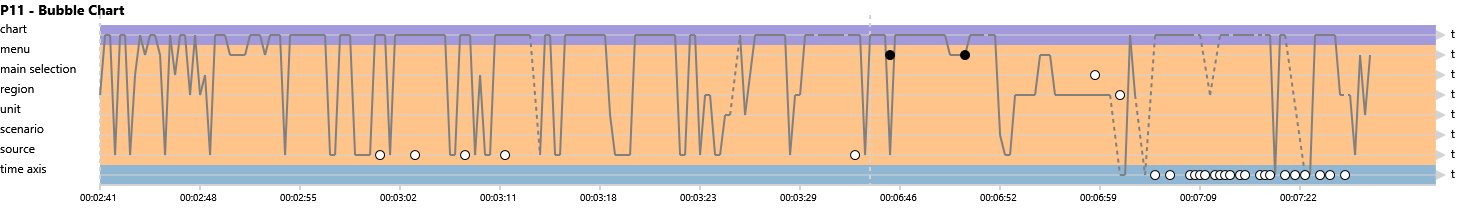
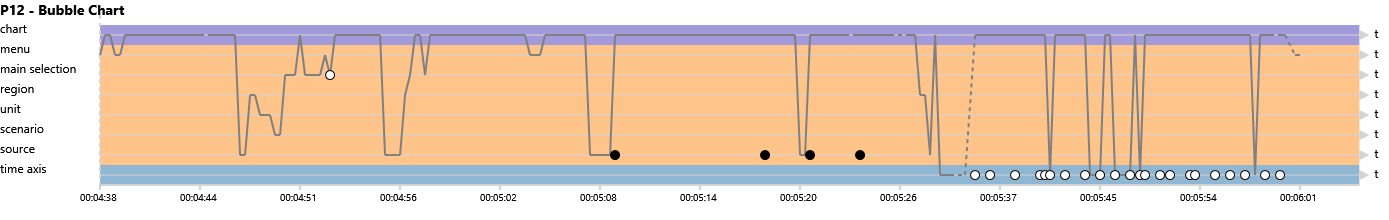
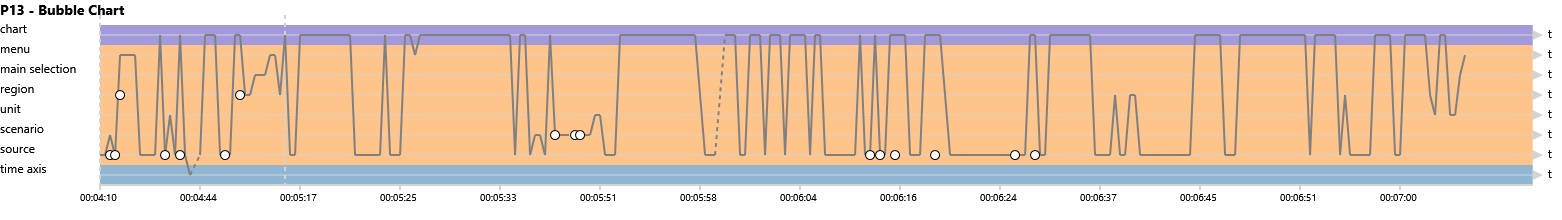
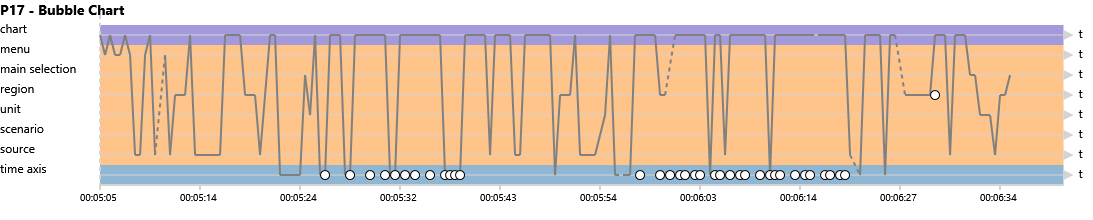
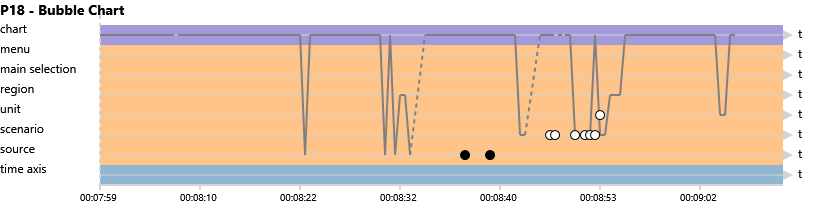
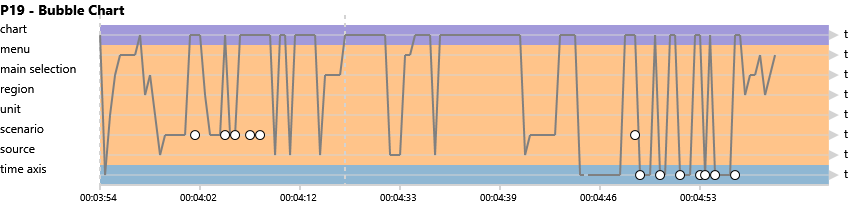
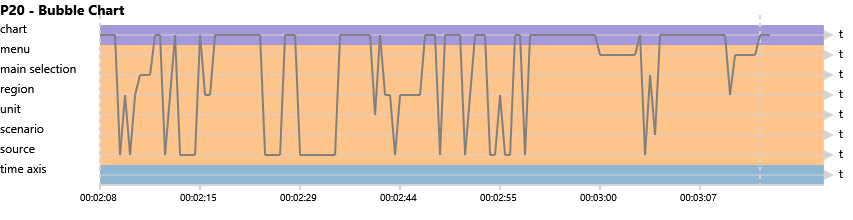
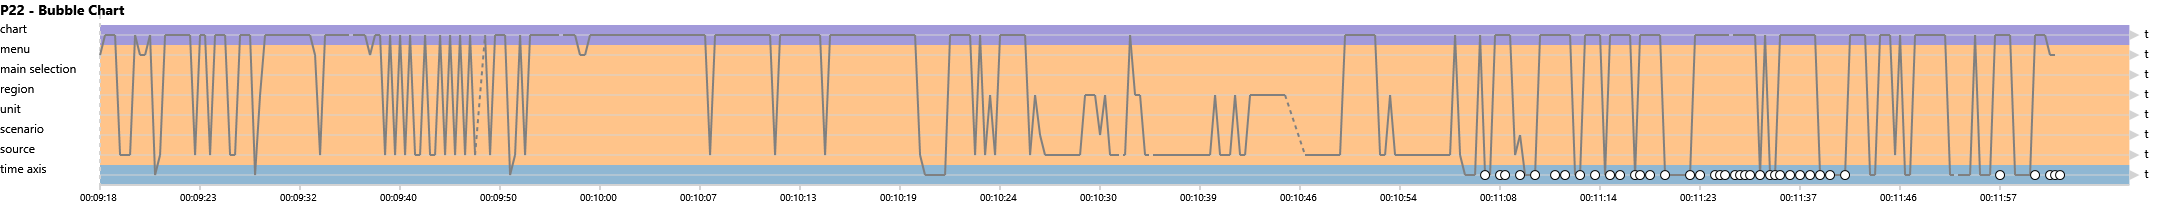
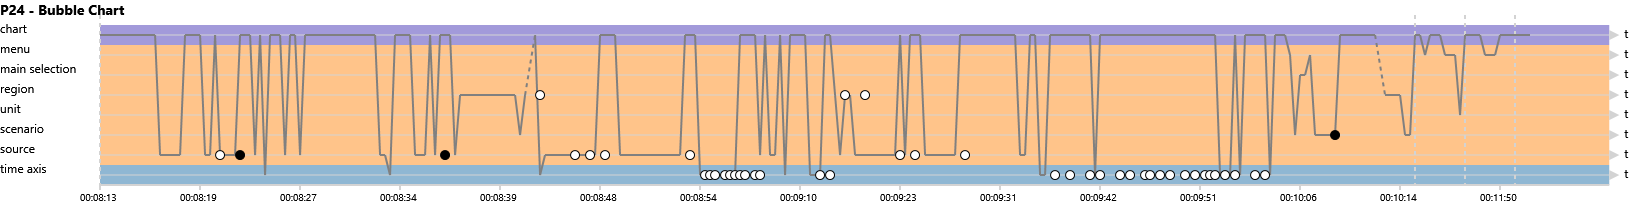
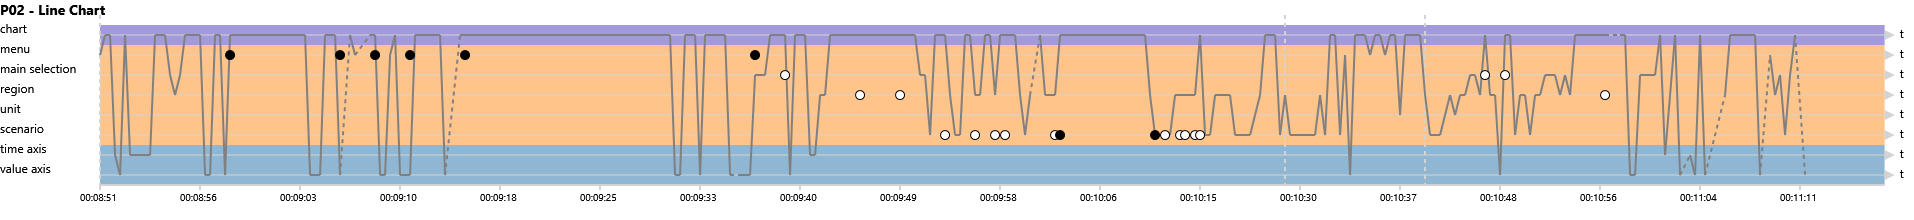
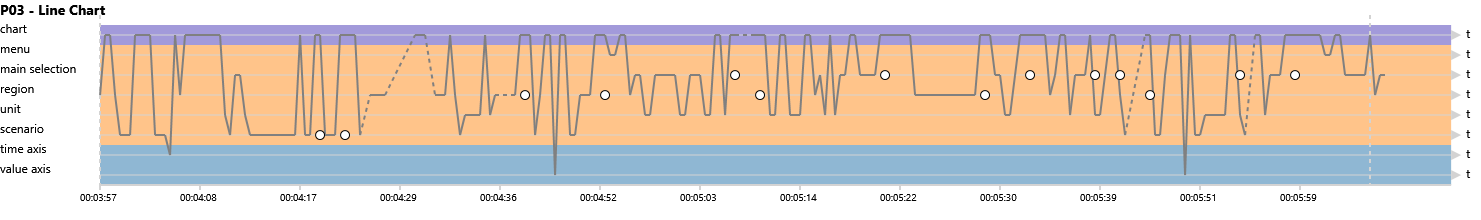
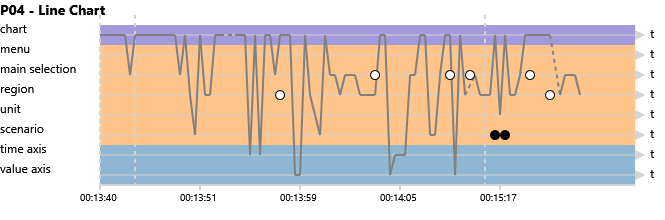
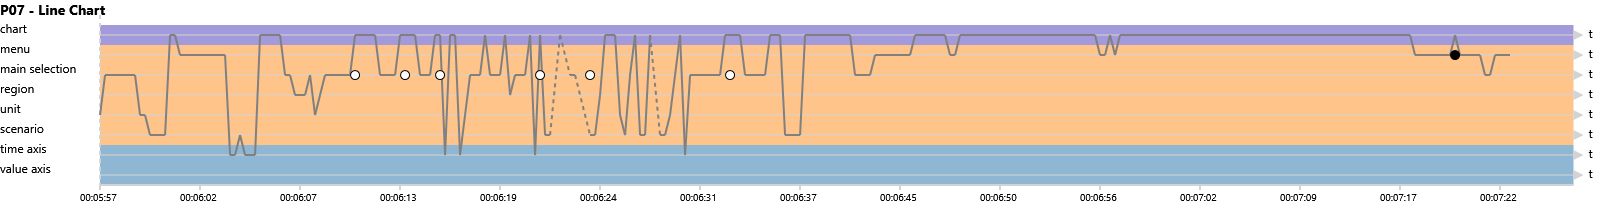
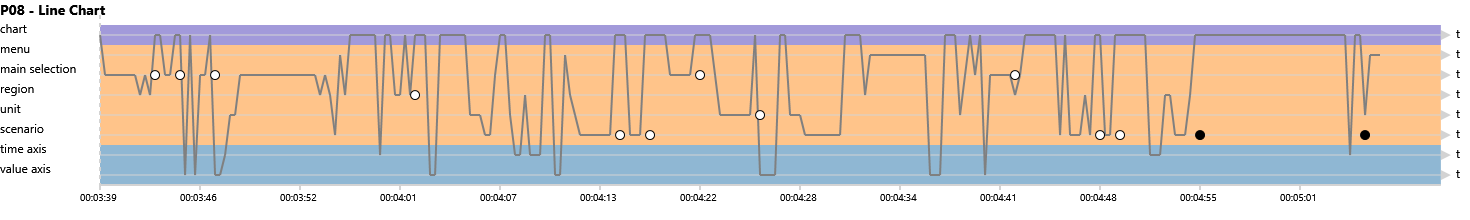
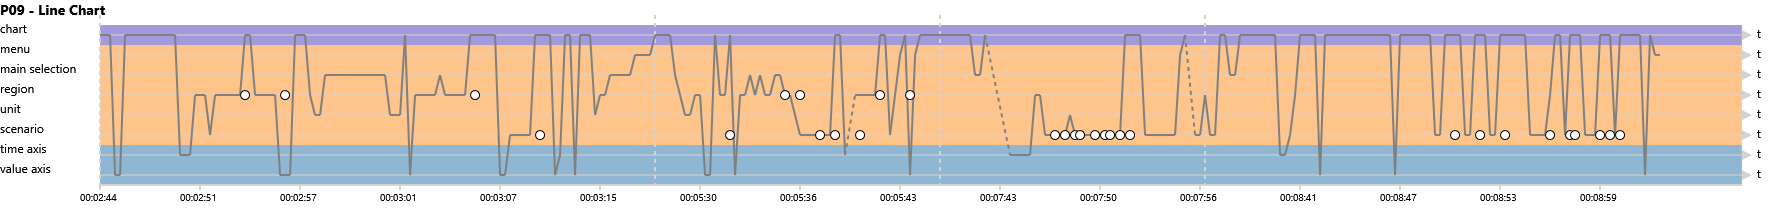
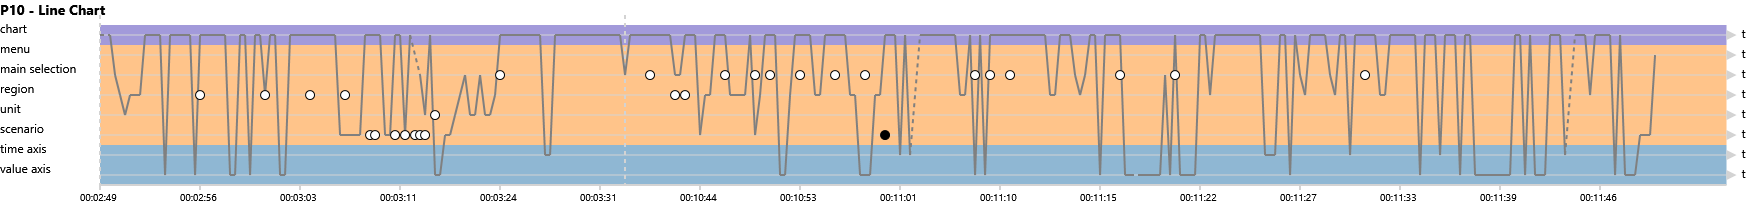
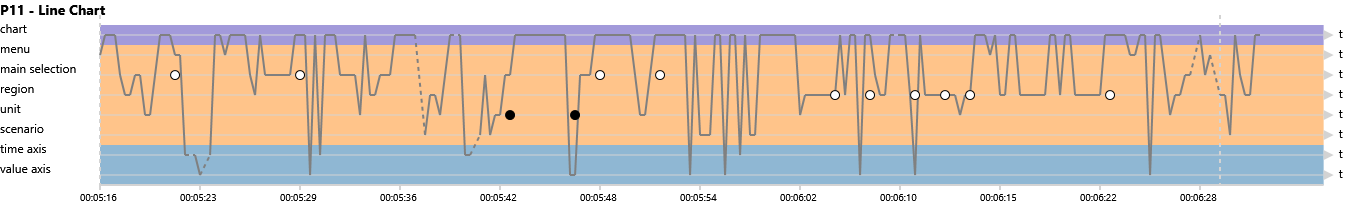
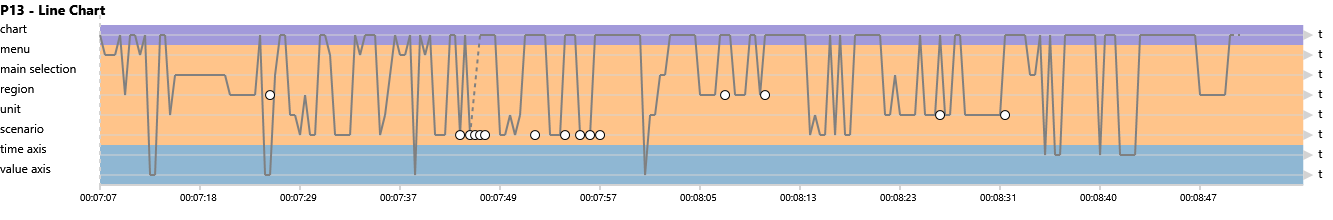
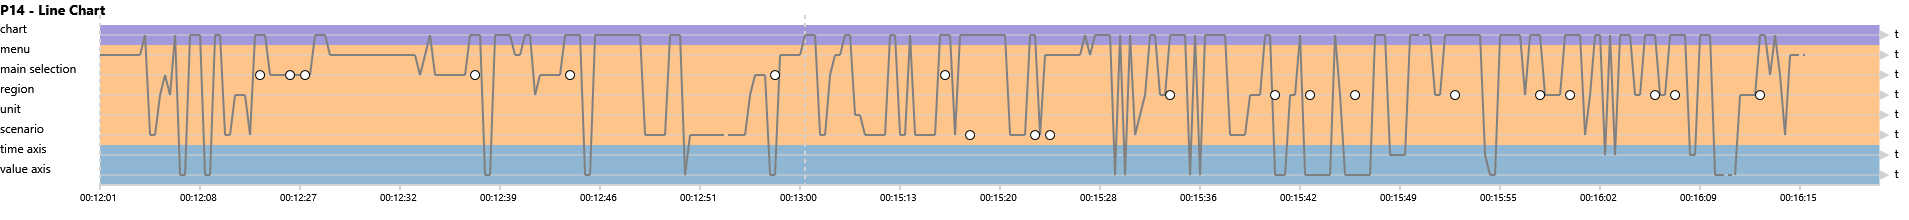
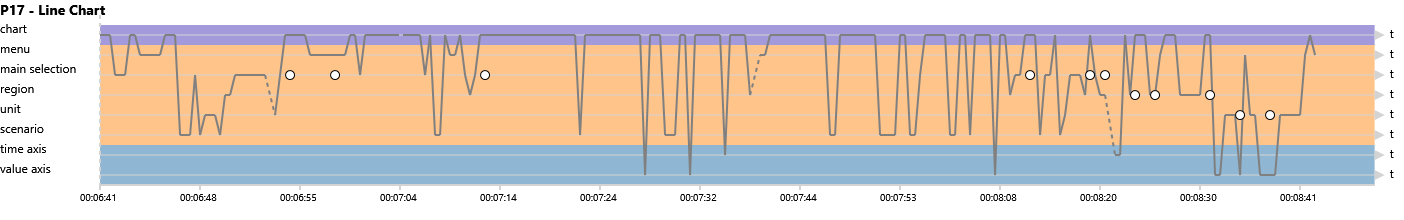
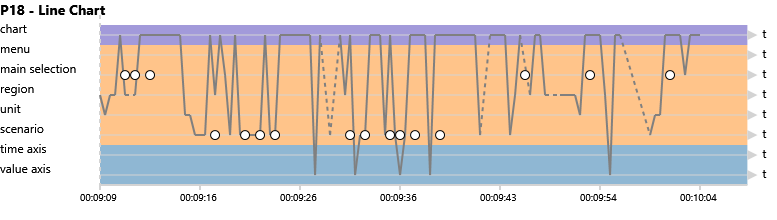
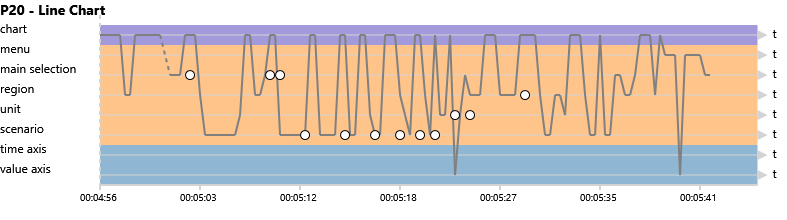
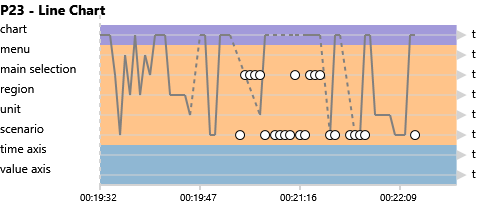
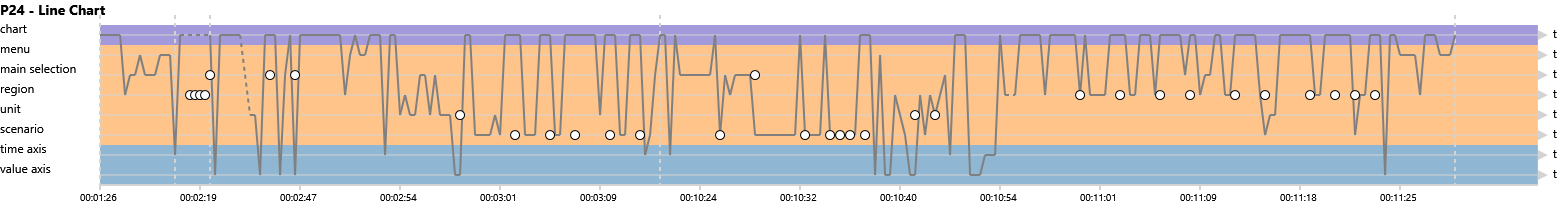
The following is a complete collection of all AOI timelines for all participants and each view. AOI timelines show the data of individual participants for one view. We created five AOI timelines for each participant: one for the START PAGE and one for each of the four views. In each AOI timeline, a horizontal light gray line is created for each AOI present in the view. Each AOI background is colored according to its AOI group: purple for the chart AOI group, orange for the control AOIs, and blue for the axes. The gray path represents the sequence of fixations of the participant. The longer the path stays in the same AOI (horizontal segments), the more fixations. Dotted parts of the path represent fixations that are not assigned to any AOI. Circles encode interactions in AOIs. Black circles mean that the participant opened and closed the help menu. Vertical gray dashed lines indicate times when the participant switched to another view and later came back to continue working with the current view. AOI timelines are useful to see the detailed data of participants and extract behavior patterns.
To download a figure in PNG version click on it.START PAGE
Participant P01

Participant P02
Participant P03
Participant P04
Participant P05
Participant P06
Participant P07
Participant P08
Participant P09
Participant P10
Participant P11
Participant P12
Participant P13
Participant P14

Participant P15
Participant P16
Participant P17
Participant P18
Participant P19
Participant P20
Participant P21
Participant P22
Participant P23

Participant P24

BAR CHART
Participant P01

Participant P02

Participant P03
Participant P04

Participant P05

Participant P06

Participant P07
Participant P08
Participant P09
Participant P10

Participant P11

Participant P12
Participant P13
Participant P14
Participant P15

Participant P16

Participant P17
Participant P18

Participant P19
Participant P20
Participant P21

Participant P22

Participant P23

Participant P24

AREA CHART
Participant P01

Participant P02
Participant P03
Participant P04

Participant P05
Participant P06

Participant P07

Participant P08
Participant P09
Participant P10

Participant P11
Participant P12
Participant P13
Participant P14
Participant P15

Participant P16

Participant P17
Participant P18
Participant P19
Participant P20
Participant P21

Participant P22
Participant P23

Participant P24
BUBBLE CHART
Participant P01

Participant P02
Participant P03
Participant P04

Participant P05

Participant P06

Participant P07

Participant P08
Participant P09

Participant P10

Participant P11
Participant P12
Participant P13
Participant P14

Participant P15

Participant P16

Participant P17
Participant P18
Participant P19
Participant P20
Participant P21

Participant P22
Participant P23

Participant P24
LINE CHART
Participant P01

Participant P02
Participant P03
Participant P04
Participant P05

Participant P06

Participant P07
Participant P08
Participant P09
Participant P10
Participant P11
Participant P12

Participant P13
Participant P14
Participant P15

Participant P16

Participant P17
Participant P18
Participant P19

Participant P20
Participant P21

Participant P22

Participant P23
Participant P24

Exploration Strategies for Discovery in Interactive Visualizations Extended Material by T. Blascheck, L. MacDonald Vermeulen, J. Vermeulen, C. Perin, W. Willett, T. Ertl, S. Carpendale is licensed under a Creative Commons Attribution-NonCommercial 4.0 International License.