EdgeLens
Nelson Wong
Sheelagh Carpendale
Managing Edge Congestion in Graphs
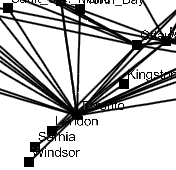
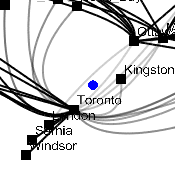
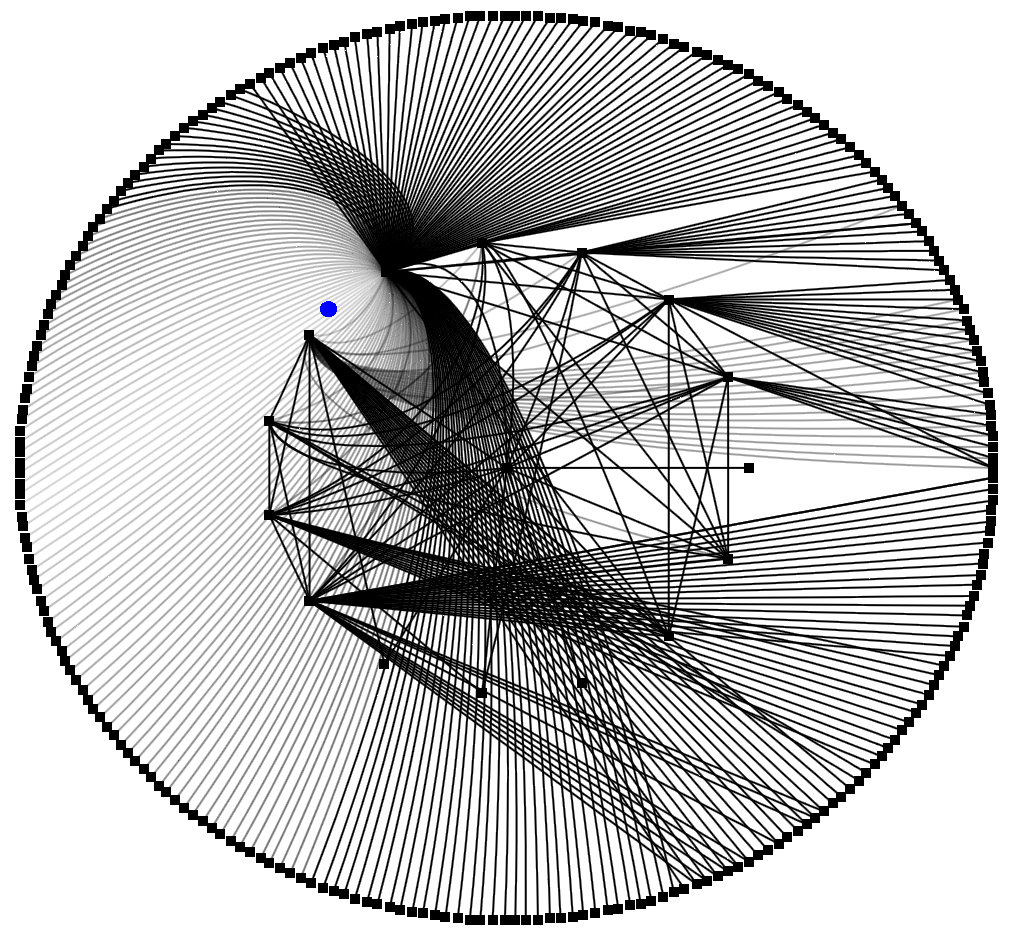
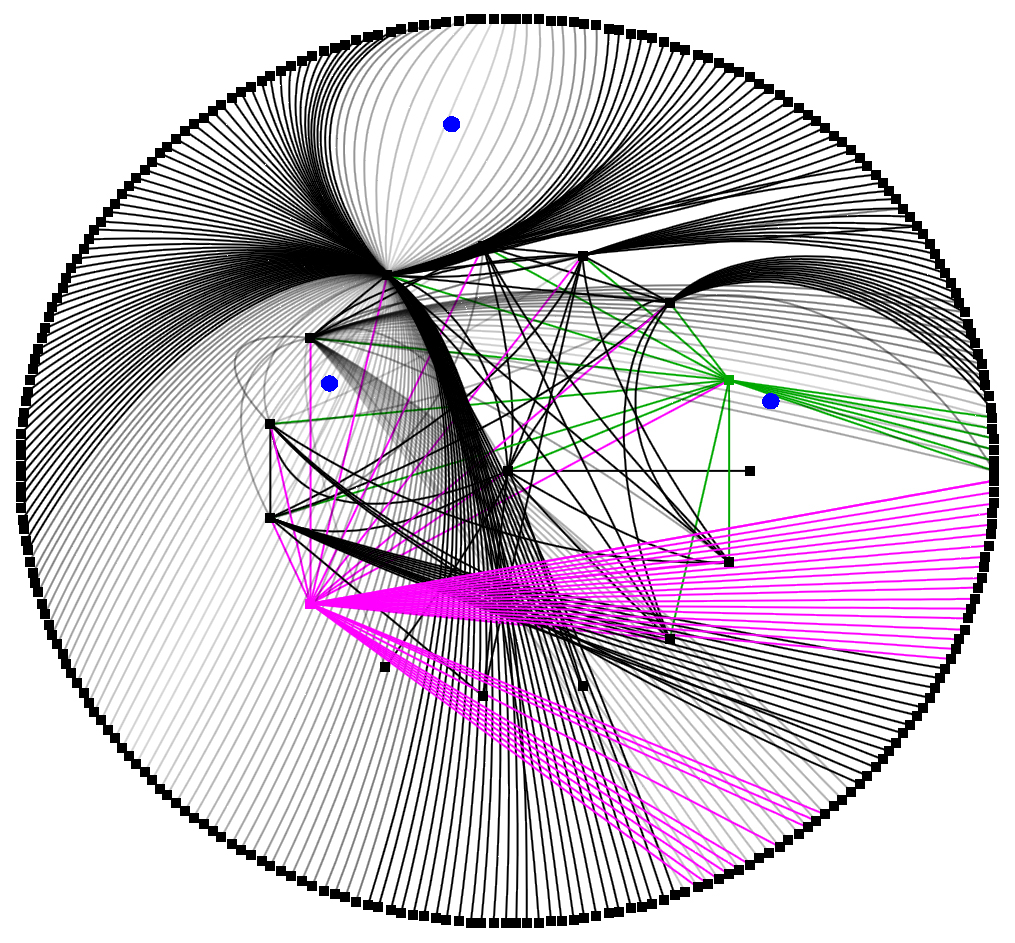
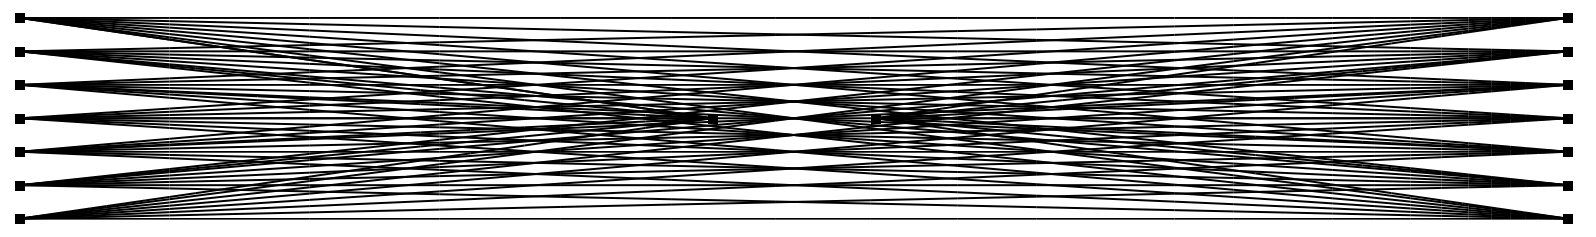
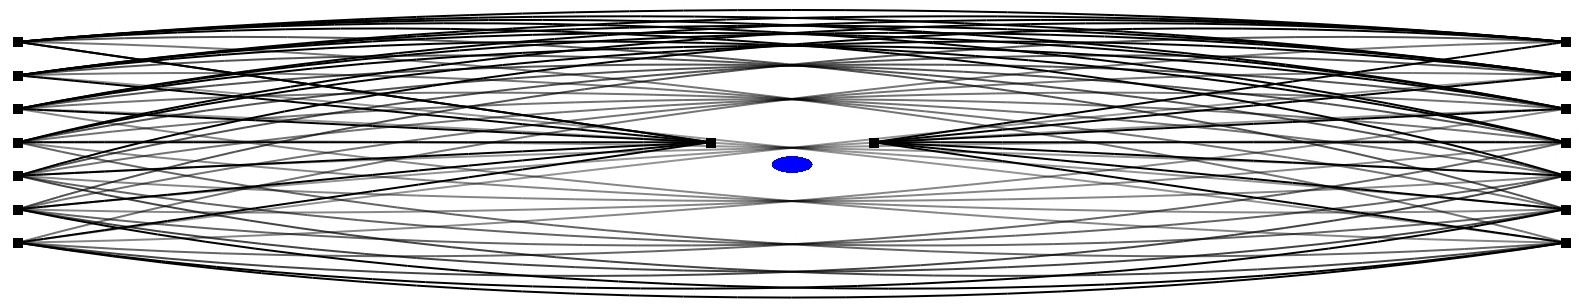
An increasing number of tasks require people to explore, navigate and search extremely complex data sets visualized as graphs. Examples include electrical and telecommunication networks, web structures, and airline routes. The problem is that graphs of these real world data sets have many interconnected nodes, ultimately leading to edge congestion: the density of edges is so great that they obscure nodes, individual edges, and even the visual information beneath the graph. To address this problem we developed an interactive technique called EdgeLens. An EdgeLens interactively curves graph edges away from a person’s focus of attention without changing the node positions. This opens up sufficient space to disambiguate node and edge relationships and to see underlying information while still preserving node layout. Initially two methods of creating this interaction were developed and compared in a user study. The results of this study were used in the selection of a basic approach and the subsequent development of the EdgeLens. We then improved the EdgeLens through use of transparency and colour and by allowing multiple lenses to appear on the graph
Images

Video
Download video (67.7 MB)
Publication
| Nelson Wong. EdgeLens: An Interactive Technique for Mitigating Edge Congestion in Graphs. Master's thesis, University of Calgary, Calgary, Alberta, Canada, March, 2005. | ||
| Nelson Wong, Sheelagh Carpendale and Saul Greenberg. EdgeLens: An Interactive Method for Managing Edge Congestion in Graphs. In Proceedings of IEEE Symposium on Information Visualization (InfoVis 2003). IEEE Press, pages 51-58, 2003. | | |
Support
This work is supported by Intel and NSERC.