EdgeMaps
Marian Dörk
Sheelagh Carpendale
Carey Williamson
Overview
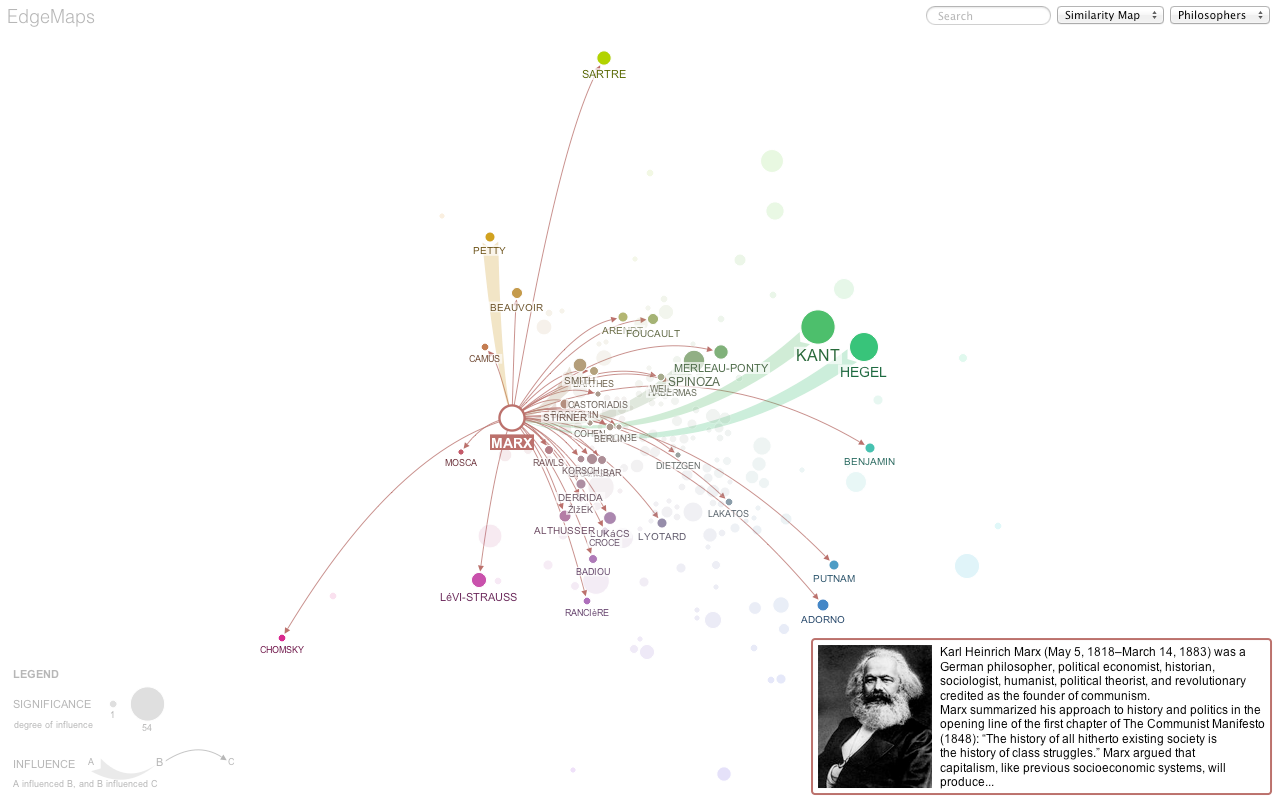
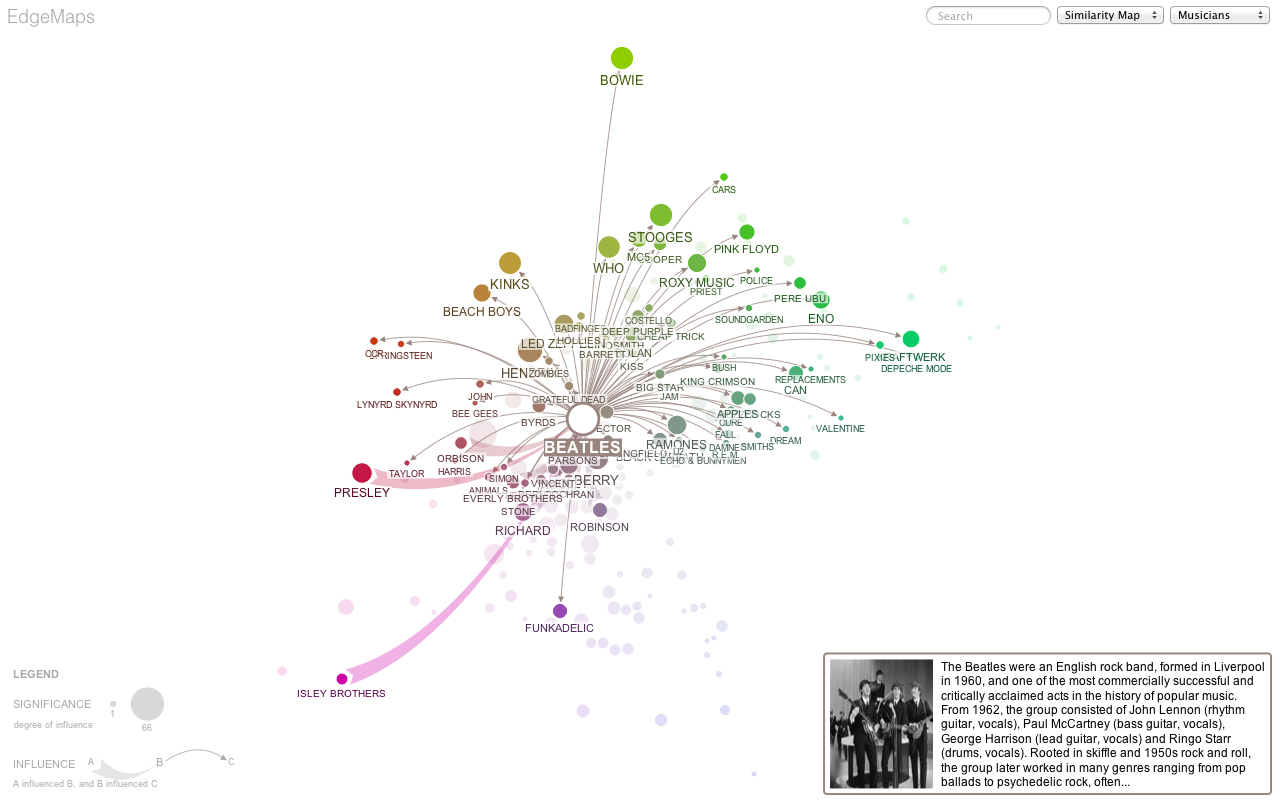
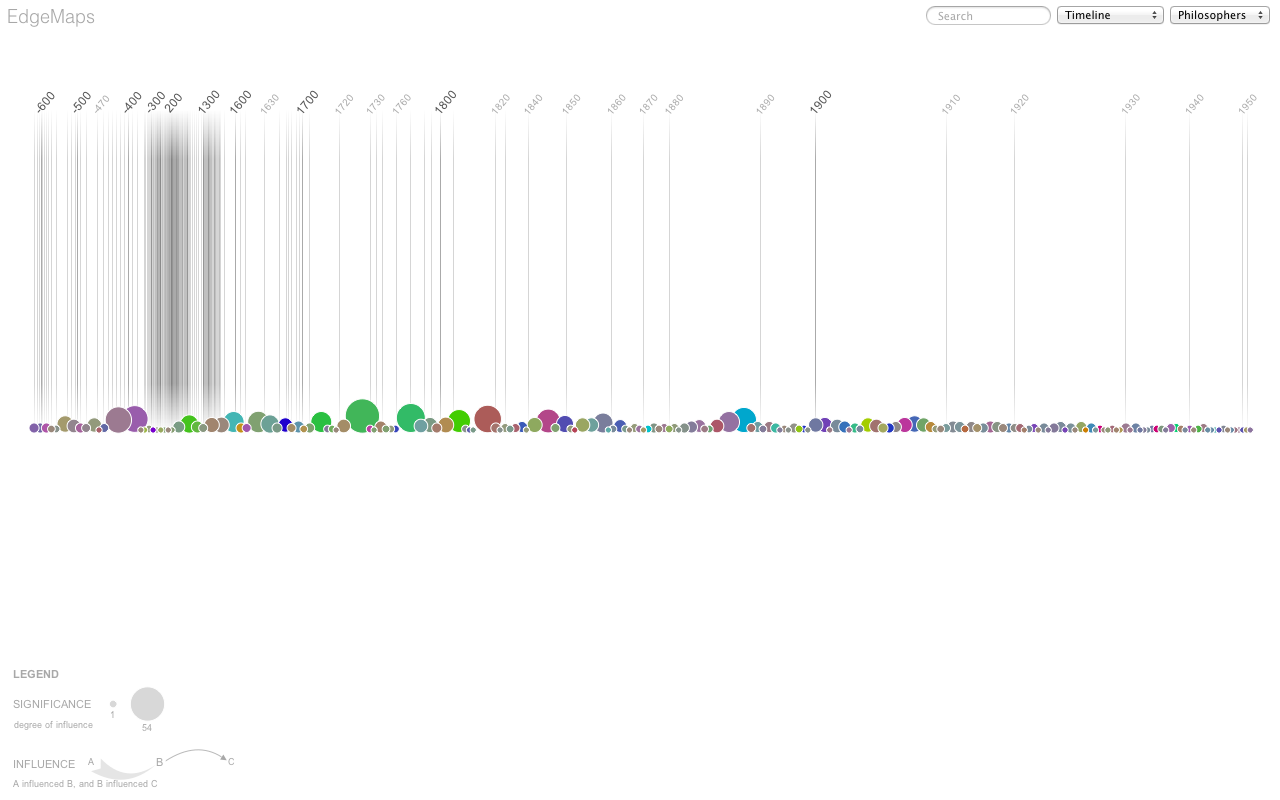
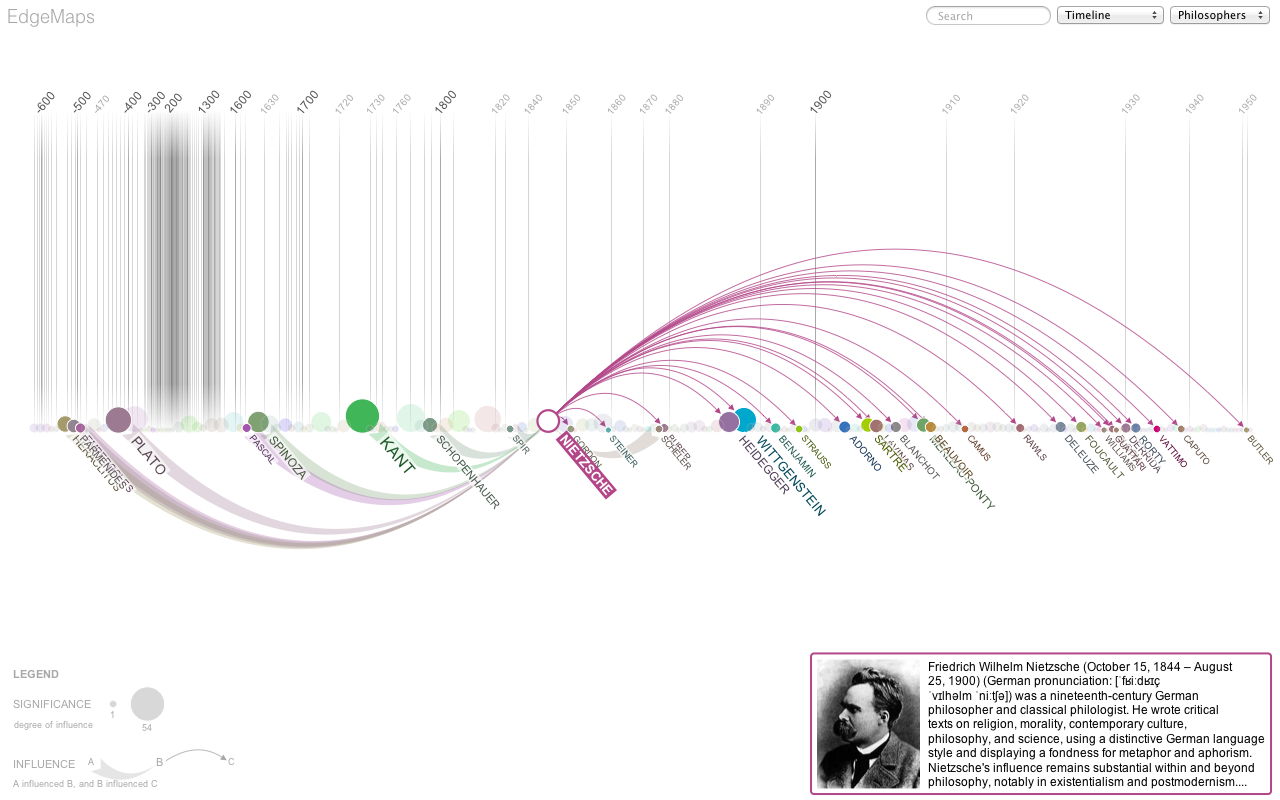
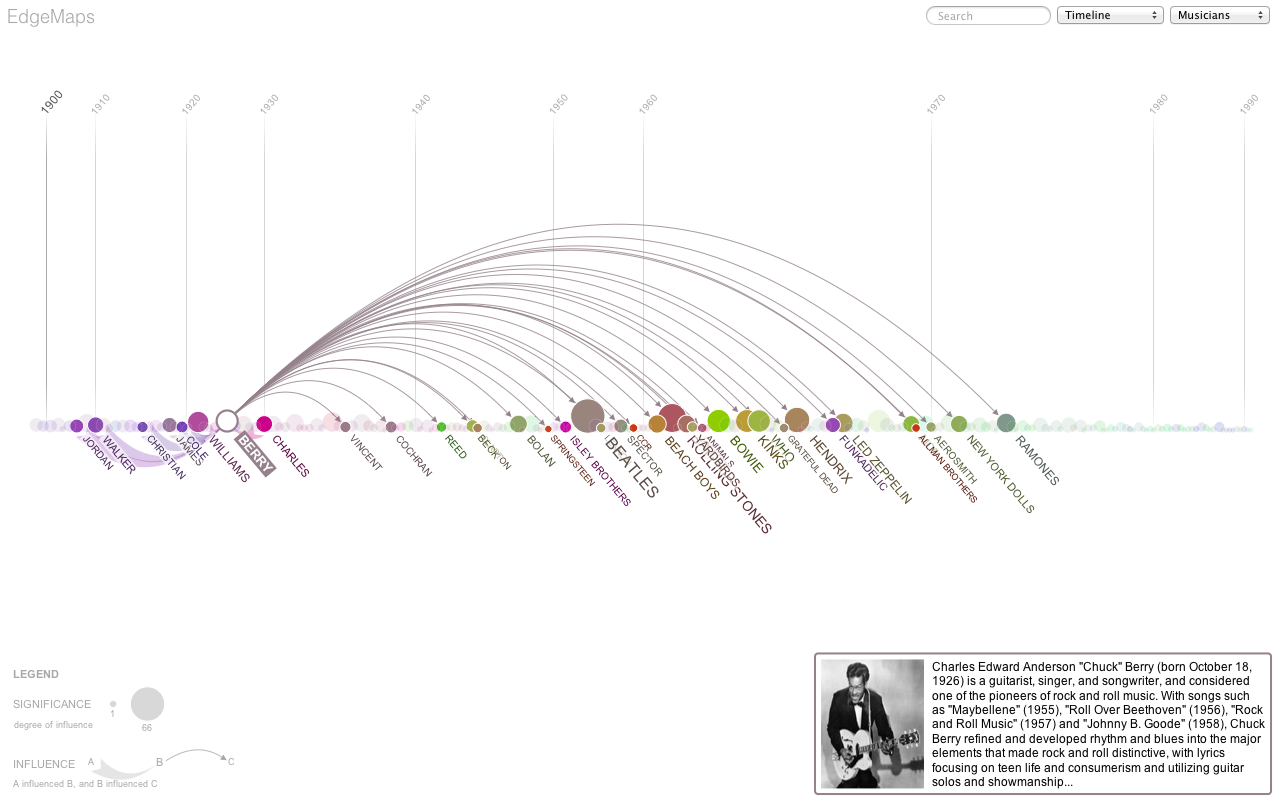
EdgeMaps is a new visualization technique that integrates the representation of explicit and implicit data relations. Explicit relations are specific connections between entities already present in a given dataset, while implicit relations are based on the similarity measures derived from shared properties in multidimensional data. Many datasets include both explicit and implicit relations, which are often difficult to represent together in information visualizations. Node-link diagrams typically focus on explicit data connections, while not incorporating implicit similarities between entities. Multidimensional scaling considers similarities between items, however, explicit links between nodes are not displayed. In contrast, EdgeMaps visualize both implicit and explicit relations by combining and extending these spatialization and graph drawing techniques. As a case study for this approach we chose a dataset of philosophers, their interests, influences, and birthdates. By activating only one node at a time and distinguishing between incoming and outgoing edges, interesting visual patterns emerge resembling fireworks and waves.
Open Demo
Images

Video
Download video: MPEG-4 Windows Media Video Flash Video
Publication
| Marian Dörk, Sheelagh Carpendale and Carey Williamson. Visualizing explicit and implicit relations of complex information spaces. Information Visualization, 11(1):5-21, Jan, 2012. First published online Nov 9, 2011. | | |
| Marian Dörk, Sheelagh Carpendale and Carey Williamson. EdgeMaps: Visualizing Explicit and Implicit Relations. In Proceedings of VDA 2011: Conference on Visualization and Data Analysis. IS&T/SPIE, 12 pages (78680G), 2011. Best paper award. | | |