Visual Thinking In Action: Visualizations As Used on Whiteboards
Jagoda Walny
Sheelagh Carpendale
Nathalie Henry Riche (Microsoft Research)
Gina Venolia (Microsoft Research)
Philip Fawcett (Microsoft Research)
Overview
While it is still most common for information visualization researchers to develop new visualizations from a data- or task- driven perspective, there is growing interest in understanding the types of visualizations people create by themselves for personal use. As part of this recent direction, we have studied a large collection of whiteboards in a research institution, where people make active use of combinations of words, diagrams and various types of visuals to help them further their thought processes. Our goal is to arrive at a better understanding of the nature of visuals that are created spontaneously during brainstorming, thinking, communicating, and general problem solving on whiteboards. We used the qualitative approaches of open coding, interviewing, and affinity diagramming to explore the use of recognizable and novel visuals, and the interplay between visualization and diagrammatic elements with words, numbers and labels.
Images

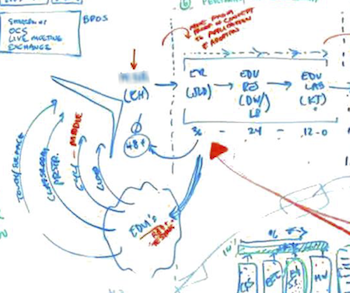
Samples from the words-to-diagrams spectrum (a) words; (b) lists; (c) words in spatial organizations; (d) words in simple diagrams; (e) words in recognized visual constructs (tree); (f) words and diagrams mixed; (g) diagrams with labels; (h) pure diagrams with no words. (See publication for details)
Publication
| Jagoda Walny, Sheelagh Carpendale, Nathalie Henry Riche, Gina Venolia and Phillip Fawcett. Visual Thinking In Action: Visualizations As Used On Whiteboards. Visualization and Computer Graphics, IEEE Transactions on, 17(12):2508 -2517, dec., 2011. | | |