Understanding Pen and Touch Interaction for Data Exploration on Interactive Whiteboards
Jagoda Walny
Bongshin Lee (Microsoft Research)
Paul Johns (Microsoft Research)
Nathalie Henry Riche (Microsoft Research)
Sheelagh Carpendale
Overview
Current interfaces for common information visualizations such as bar graphs, line graphs, and scatterplots usually use the WIMP (Windows, Icons, Menus and a Pointer) interface paradigm. However, this leads to multiple levels of indirection via cascading menus, dialog boxes, and control panels. Recent advances such as the availability of pen and touch interaction challenge us to investigate more direct access to both the visualizations and the data they portray.
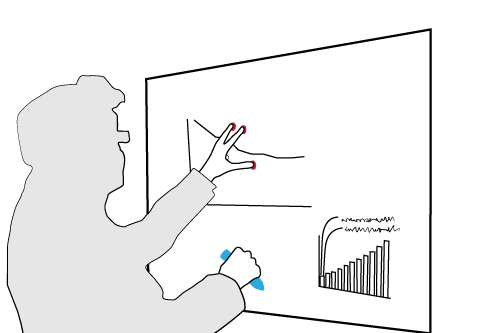
We conducted a Wizard of Oz study to explore applying pen and touch interaction to information visualization interfaces on interactive whiteboards. Our wizard acted as a robust and flexible pen and touch recognizer, giving participants maximum freedom in how they interacted with the system. Our qualitative analysis of our participants' interactions yielded insights about pen and touch interactions in the context of learnability and the interplay between pen and touch gestures, which led to suggestions for designing pen and touch enabled interactive visualization interfaces.
Additional Project Pages
- Lead author Jagoda Walny's SketchInsight project page.
- SketchInsight project page at Microsoft Research.
Publication
| Jagoda Walny, Bongshin Lee, Paul Johns, Nathalie Henry Riche and Sheelagh Carpendale. Understanding Pen and Touch Interaction for Data Exploration on Interactive Whiteboards. Visualization and Computer Graphics, IEEE Transactions on, 18(12):2779-2788, December, 2012. | | |