Transmogrifiers
John Brosz
Miguel Nacenta
Ricky Pusch
Sheelagh Carpendale
Christophe Hurter
Overview
A transmogrifier is a novel interface that enables quick, on-the-fly graphic transformations. A region of a graphic can be specified by a shape and transformed into a destination shape with real-time, visual feedback. Both origin and destination shapes can be circles, quadrilaterals or arbitrary shapes defined through touch. Transmogrifiers are flexible, fast and simple to create and invite use in casual InfoVis scenarios, opening the door to alternative ways of exploring and displaying existing visualizations (e.g., rectifying routes or rivers in maps), and enabling free-form prototyping of new visualizations (e.g., lenses).
Additional Project Websites:
- Transmogrifiers project page.


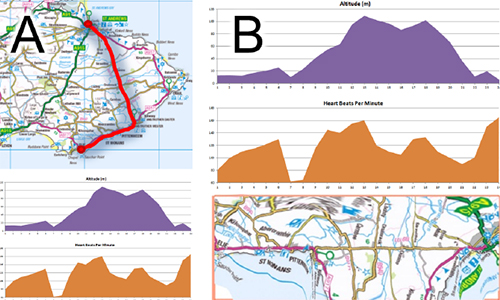
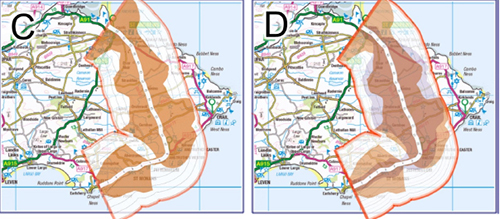
A) Cycling data: a map with a route and area graphs with average altitude (purple) and heart-rate (orange) at each kilometer. B) The rectified route map aligned under the linear graphs enables comparison of the measured variables to the map features. C) The heart-rate graph wrapped around the route in the map shows effort in spatial context. D) Same as C, but with multiple variables. Map used contains Ordnance Survey data c Crown copyright and database right 2013.
Publications
| John Brosz, Miguel A. Nacenta, Richard Pusch, Sheelagh Carpendale and Christophe Hurter. Transmogrification: UIST Demo Software. Earned UIST 2013 Honorable Mention Demo Award. Available at transmogrifiers.org., 2013. | | |
| John Brosz, Miguel A. Nacenta, Richard Pusch, Sheelagh Carpendale and Christophe Hurter. Transmogrification: casual manipulation of visualizations. In Proceedings of the 26th annual ACM symposium on User interface software and technology. (New York, NY, USA), ACM, pages 97-106, 2013. | | |